College Search
What is the College Search Tool?
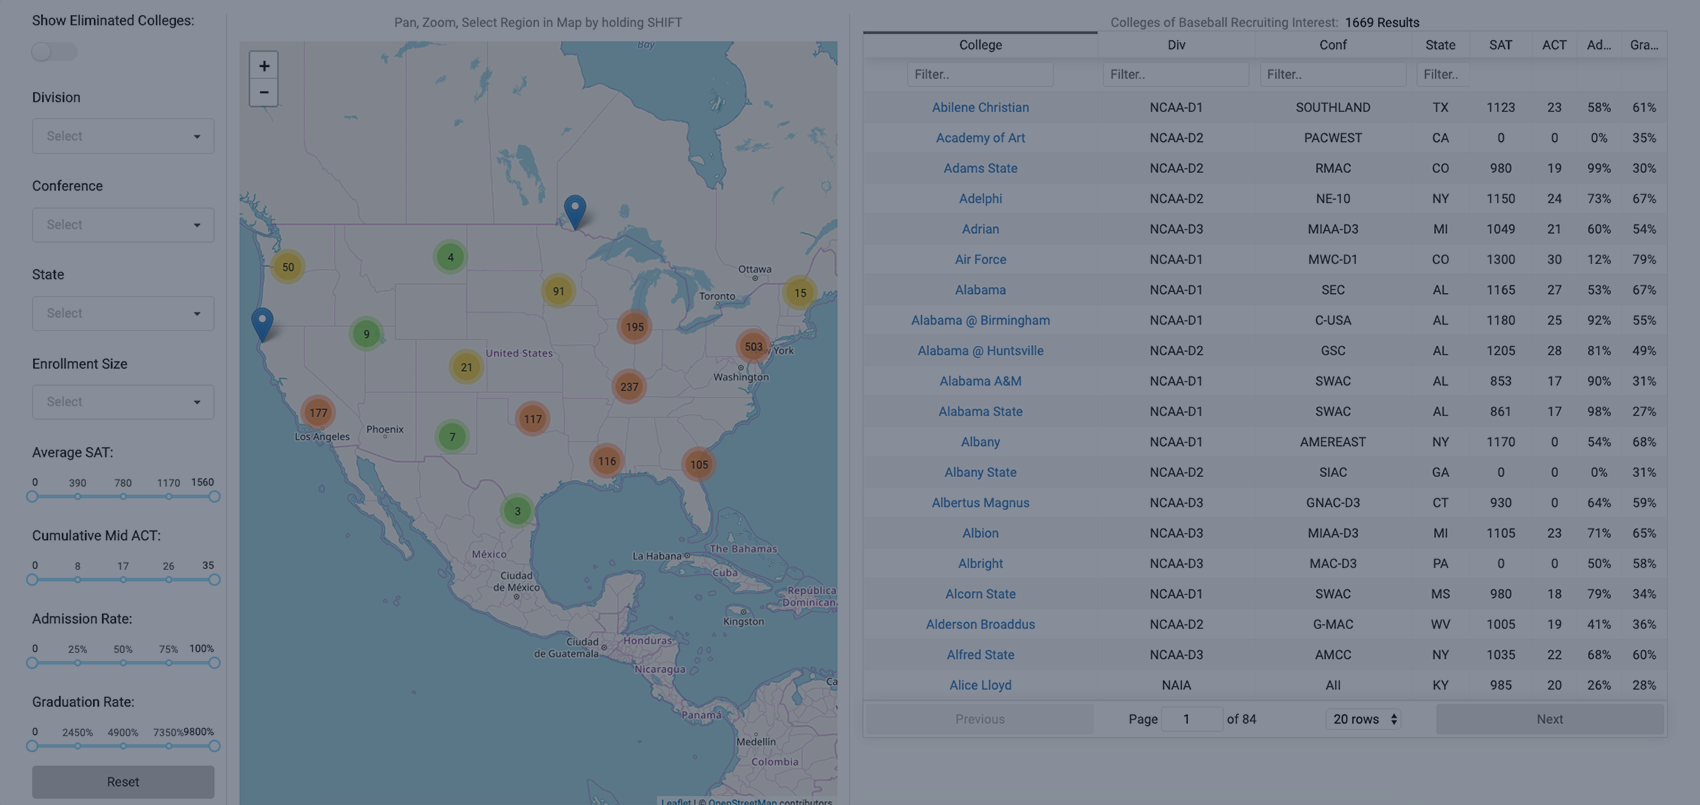
The College Search Tool provides student-athletes and/or parents a powerful, analytical, research tool to begin the search for a college baseball program. The goals of a college coach are simple: find the student-athletes who will be successful in the classroom and on the diamond. From a student-athlete’s perspective, deciding on a right-fit school and its baseball program is more difficult. It’s up to you to do the research to determine if that school and its baseball program are the best fit for you.
Search Criteria
Improve the Relevance of Your Results
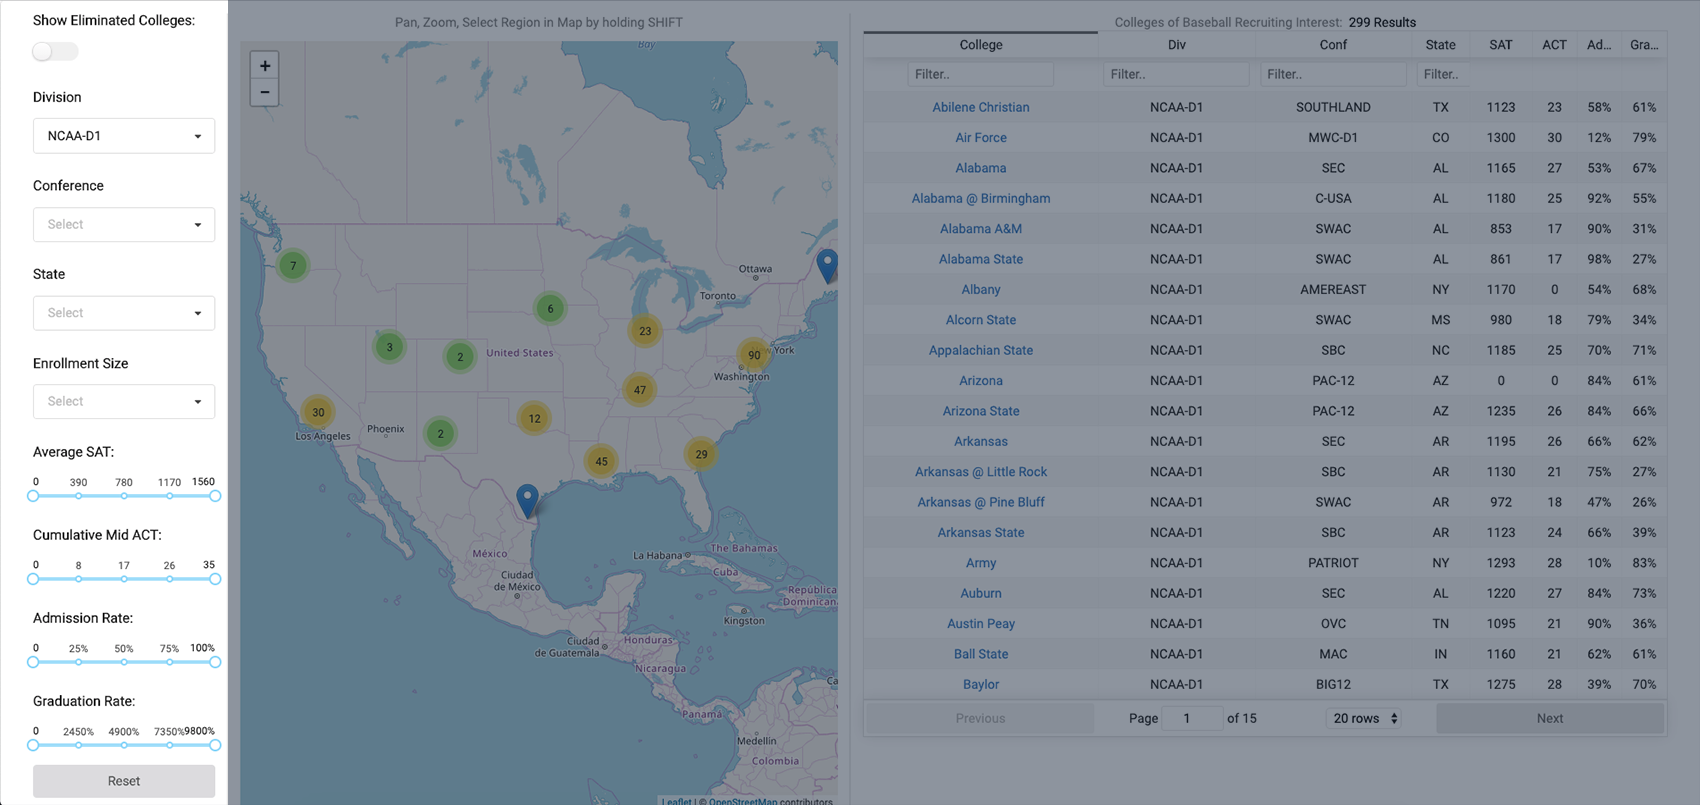
Starting with a list of colleges with baseball programs, you can narrow your selection criteria by division, conference and/or desired state. This tool will yield a cohort of schools which will allow you to take a deeper dive into your college search within minutes of accessing our website.
Geographic Map
School Display by Geographic Area
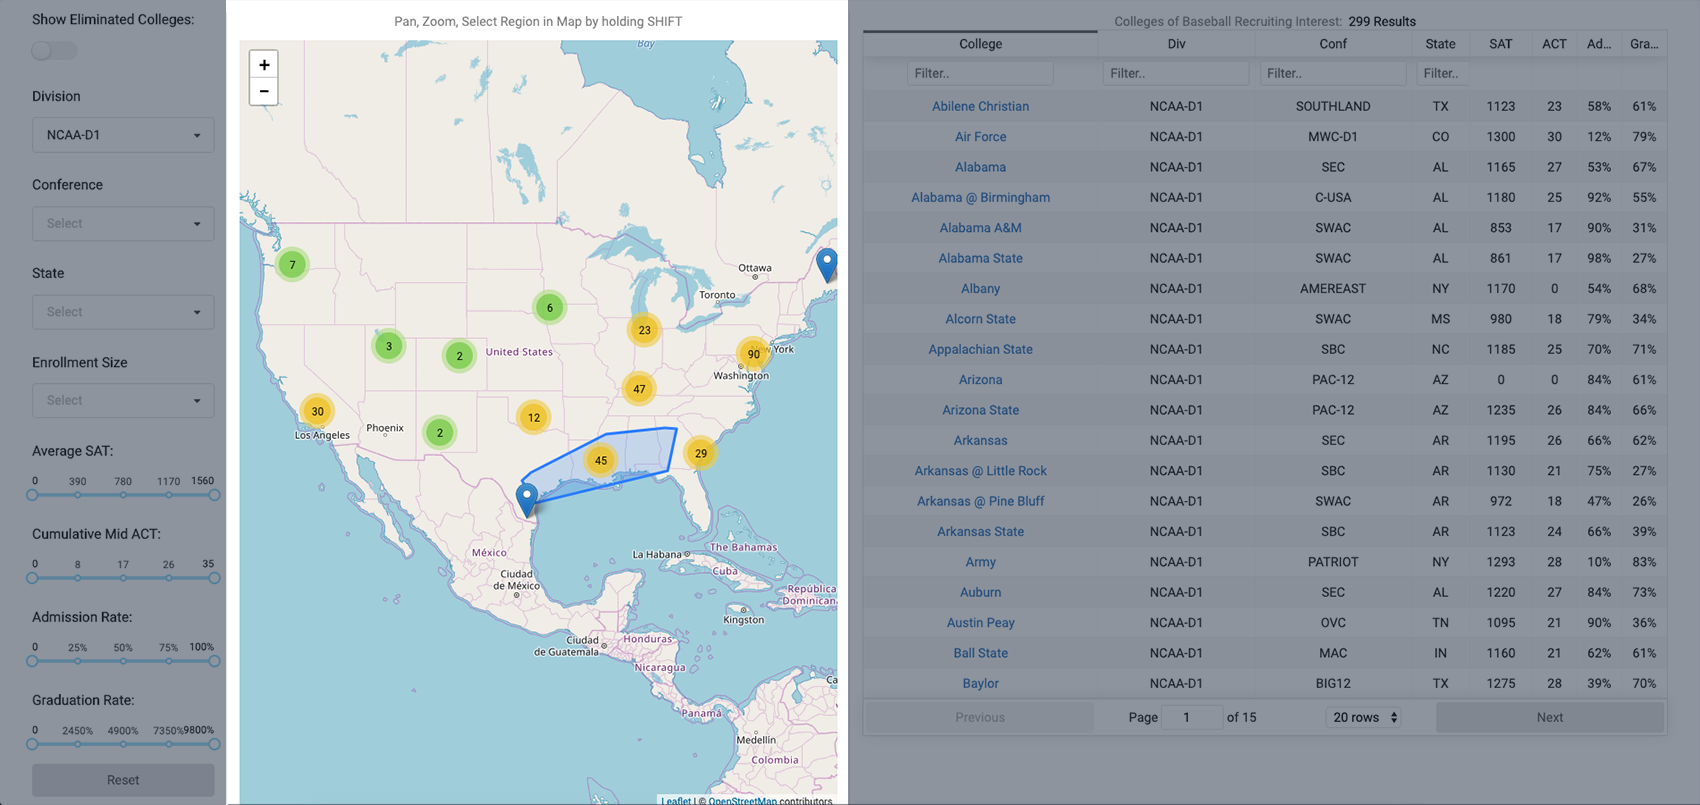
As you use the filtering to narrow your selection criteria, the map area will dynamically display the location of schools. As an example, we’ve chosen the NCAA-D1 division, thus displaying a cohort of NCAA-D1 schools with baseball programs by area. You can drill down further into a geographical location to see and select schools in a desired area.
College Search Results List
Generate list of schools
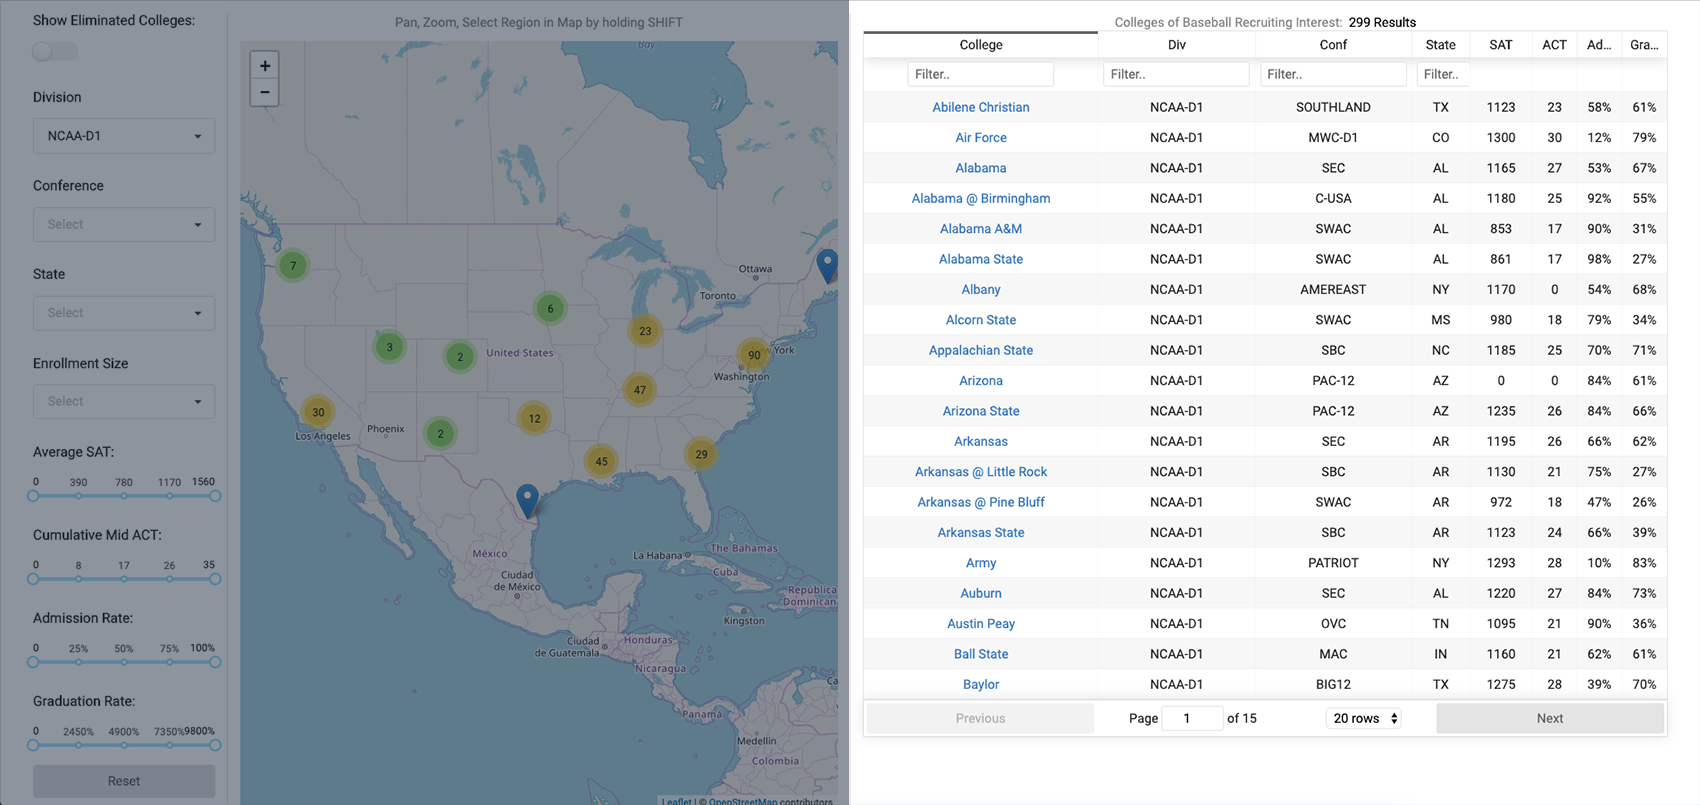
The college search list provides a flexible framework to target schools of interest. The search fields below the headings can be used as the initial or an additional filter to identify your target school. Additionally, you can sort by any criteria within the college search listing by clicking on the headings at the top of each row. When you have identified a school of interest, click the school to display their baseball profile.

Player Distribution by State
Distribution map of where players were recruited from
“Where the student-athletes come from” is one of the most important insights. Understanding where players are from can provide prospective student-athletes with an idea of where coaching staff are recruiting players. Over time a school determines whether recruiting talent out of their regional area pays off in terms of time, effort and dollars spent. You may see a coach recruiting mostly local talent from in-state. That doesn’t mean you can’t get recruited if you are out-of-state. You may just have to be willing to make the effort to be seen.
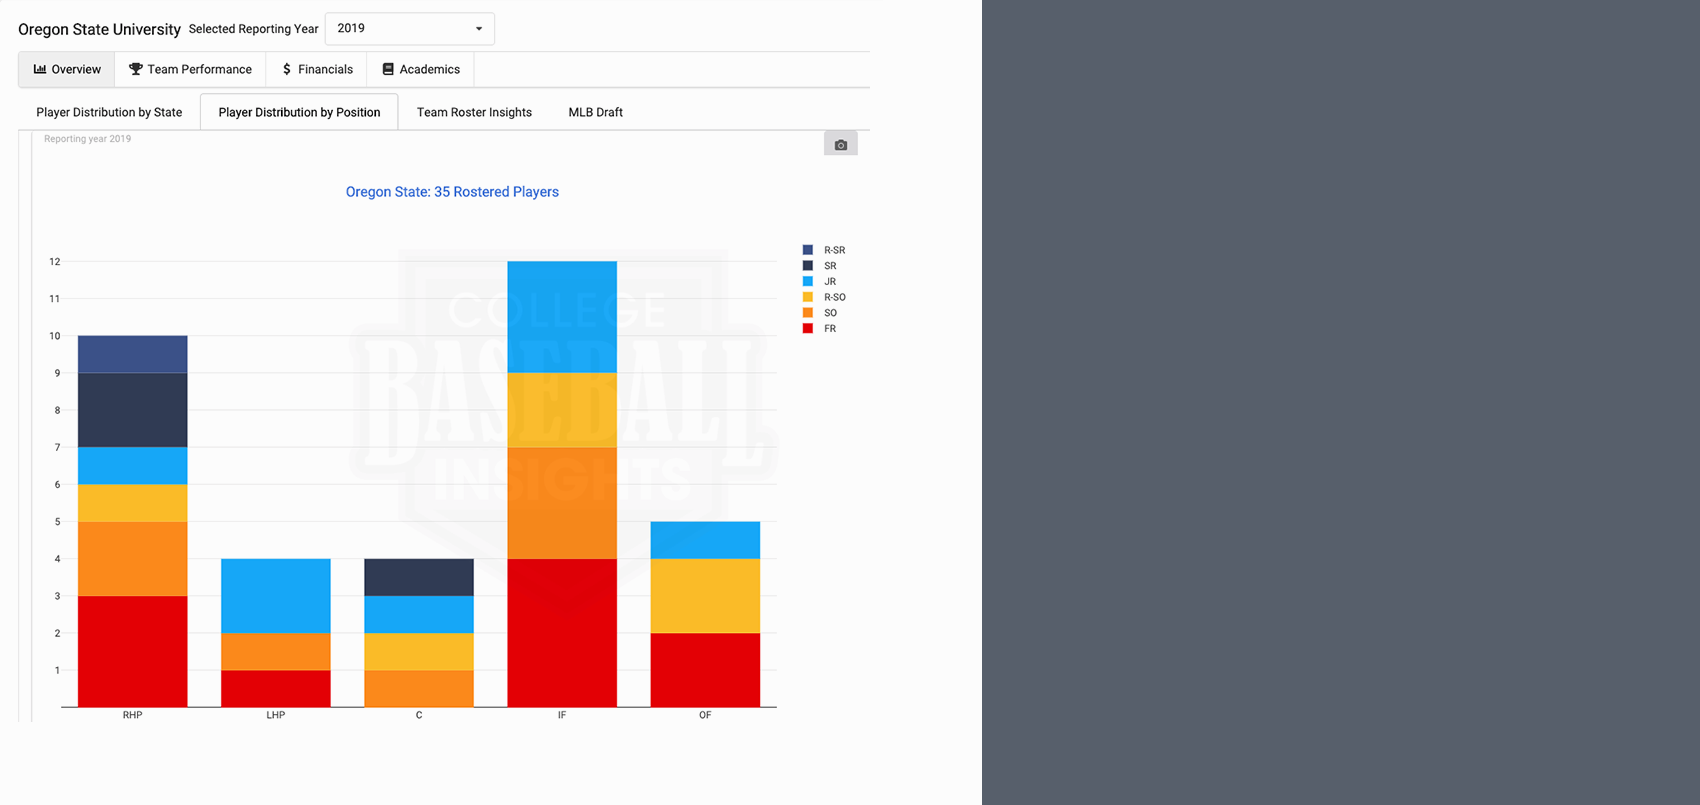
Player Distribution by Position
Team Roster Players Distribution by primary position and graduation class
Most coaches recruit players based on need. This insight can help you understand your competition for playing time. If there is a log jam of underclass players at your position, there is a strong chance they are currently not recruiting for that position. However, there is still more detective work to be done. Use the hyperlink to drill down to the college’s website’s baseball roster to review player bios and statistics.

Team Roster Insights
Shows Roster Key Performance Indicators (KPIs)
College Baseball Insights provides various Key Performance Indicators that would individually require significant time and effort to research, e.g., Player Attrition, Player Transfers, Redshirts and Collegiate Summer League participation. For example, the college summer league insights provide a view of a coach’s ability to assign players to a particular summer league. This type of information will take your college baseball research to the next level.

JUCO Placement
Number of Players on 4yr College Rosters
As a bonus, when reviewing a Junior College, our website provides insights into the school’s success transferring student-athletes to 4-year college baseball programs.
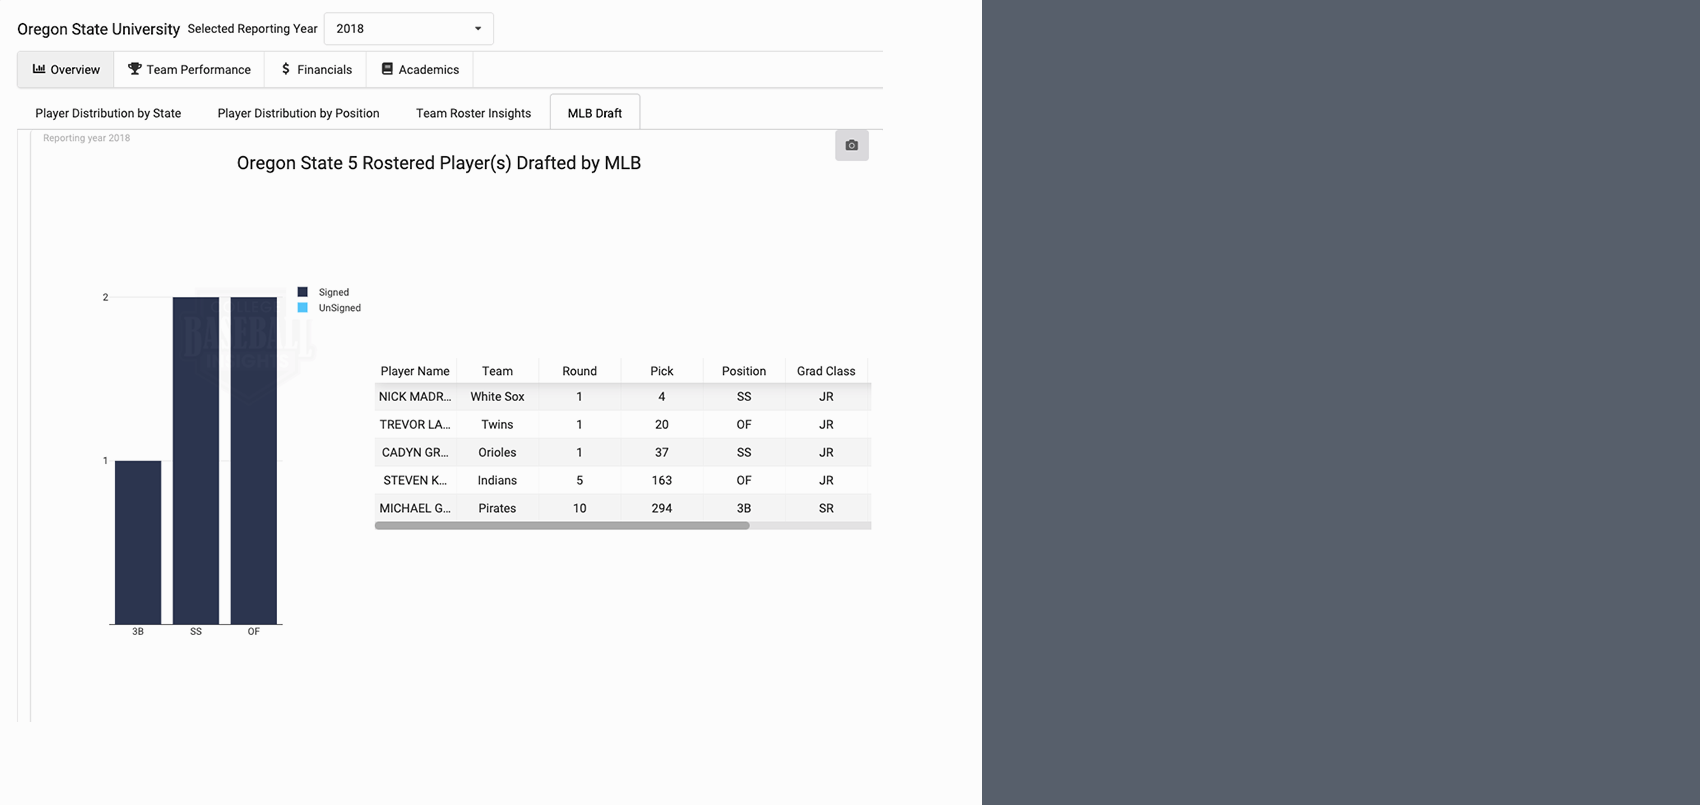
MLB Draft
Number of players drafted and signed in selected year
If you intend to play baseball at the next level, this is information that you should consider. The number of players chosen in the MLB draft, coupled with the year they were selected, can reveal if the baseball program at the school you are considering has the ability to promote their most talented players. It also shows whether that relationship has been consistent over time. In addition, this can help predict which positions may open up on the roster due to drafted players exiting the program early.
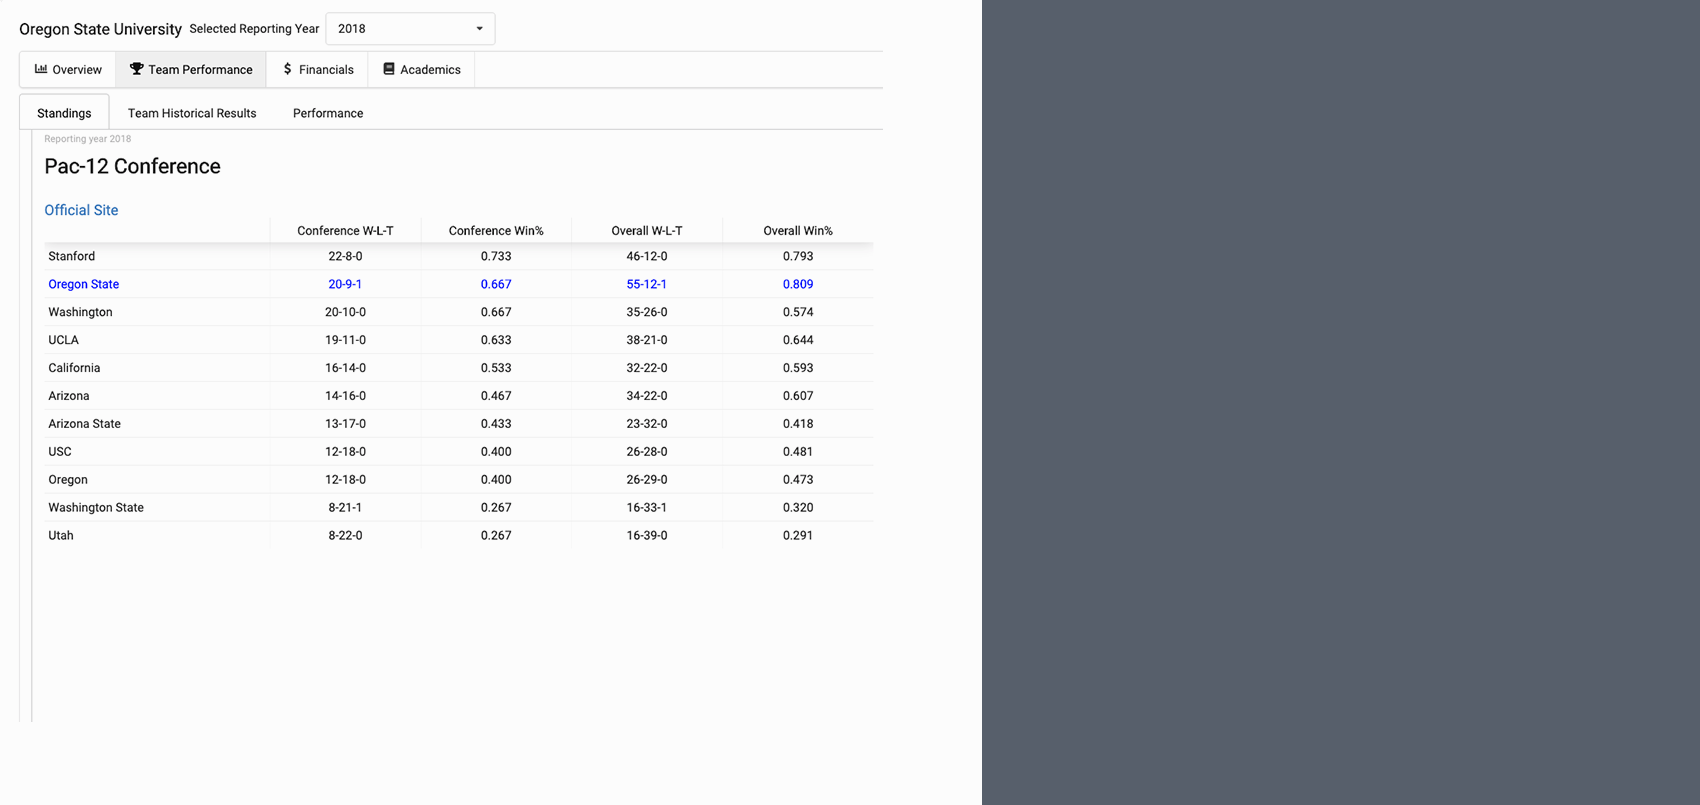
Conference Standings
Where did the college finish in their conference?
You will want to check a college’s conference standing over the past several years to determine consistent performance over time. Has the school won their conference consistently or been in the top two or three schools? These are things you will want to know to be able to compare schools both inside a conference and between conferences. You may be able to get more playing time on a team that is less competitive, but it can be a challenge playing on a team that consistently ranks at the bottom of their conference.

Team Historical Results
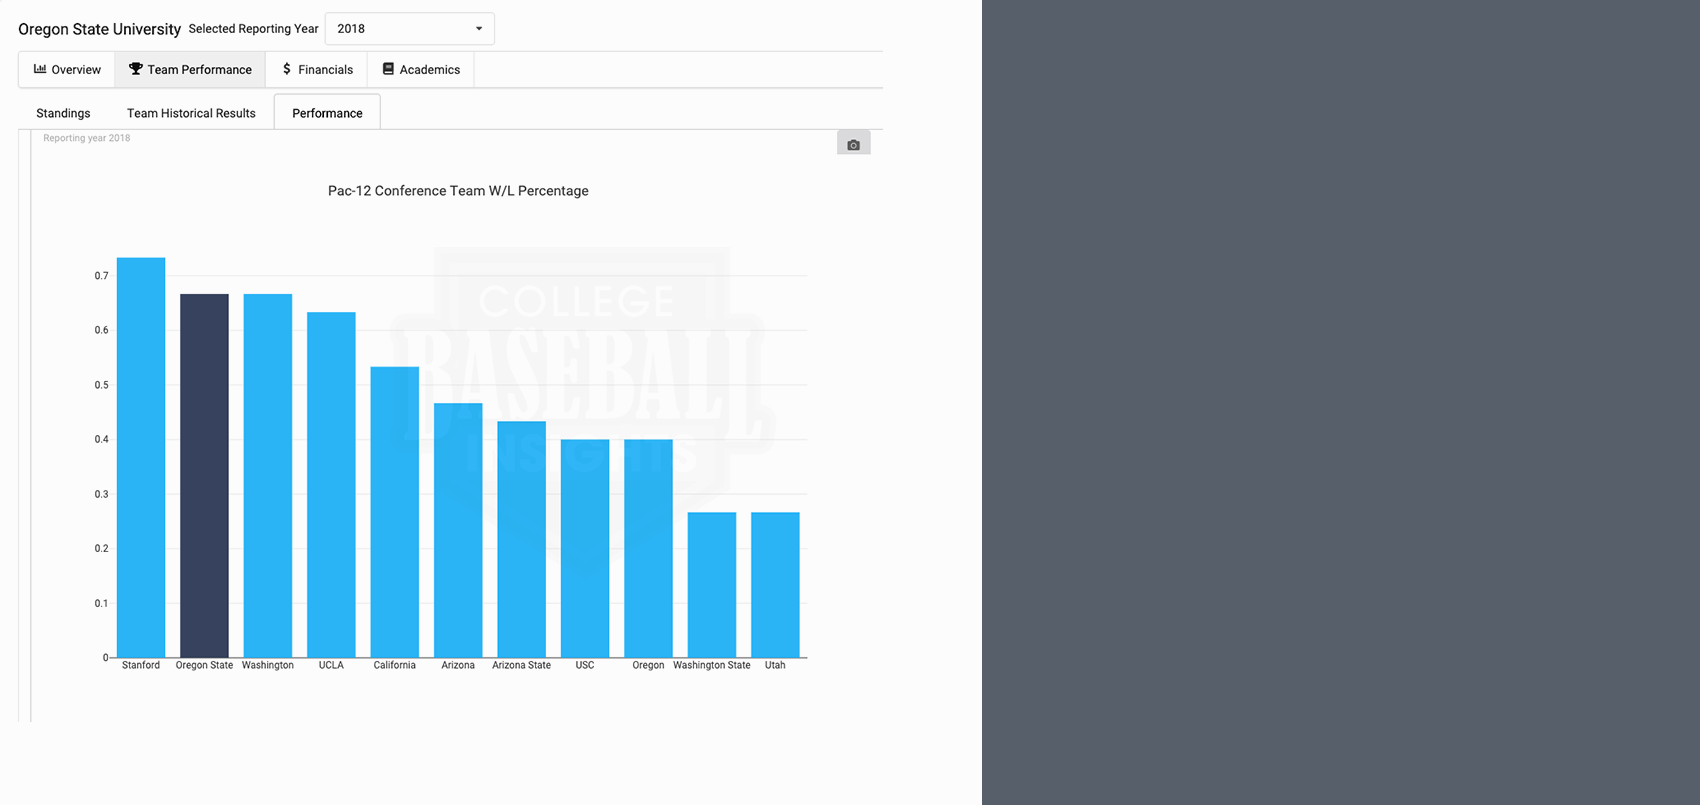
Conference Performance
Team’s Conference and Overall Win/Loss Record
Looking at how the teams in your chosen school’s conferences have performed in both their conference and non-conference games is a great way to evaluate the overall competitiveness of the conference and the teams. What does their out-of-conference schedule look like? Are they playing highly competitive teams? How do their Win/Loss records compare?

EADA Compliance Reporting
Athletic Program Participation Rates and Financial Support Data
Every co-educational institution of higher learning that participates in a federal student aid program is required to complete and publish an annual EADA (Equity in Athletics Disclosure Act) report by the 4th quarter. Some of the important insights derived from these reports include:
- Comparing the roster size listed on the school’s website to the roster size reported to Department of Education.
- Coaching commitment (full time vs. part time) and school’s budget toward sports.

Expense Allocation by Sport
Shows Total Expenses Allocated by Sport
Further examination of the EADA report provides data on the amount of the college’s athletic budget that is allocated to each sport. This can be an eye-opener for many, as it becomes evident that the budgets for the revenue-generating sports are many times that of the non-revenue sports, such as baseball.
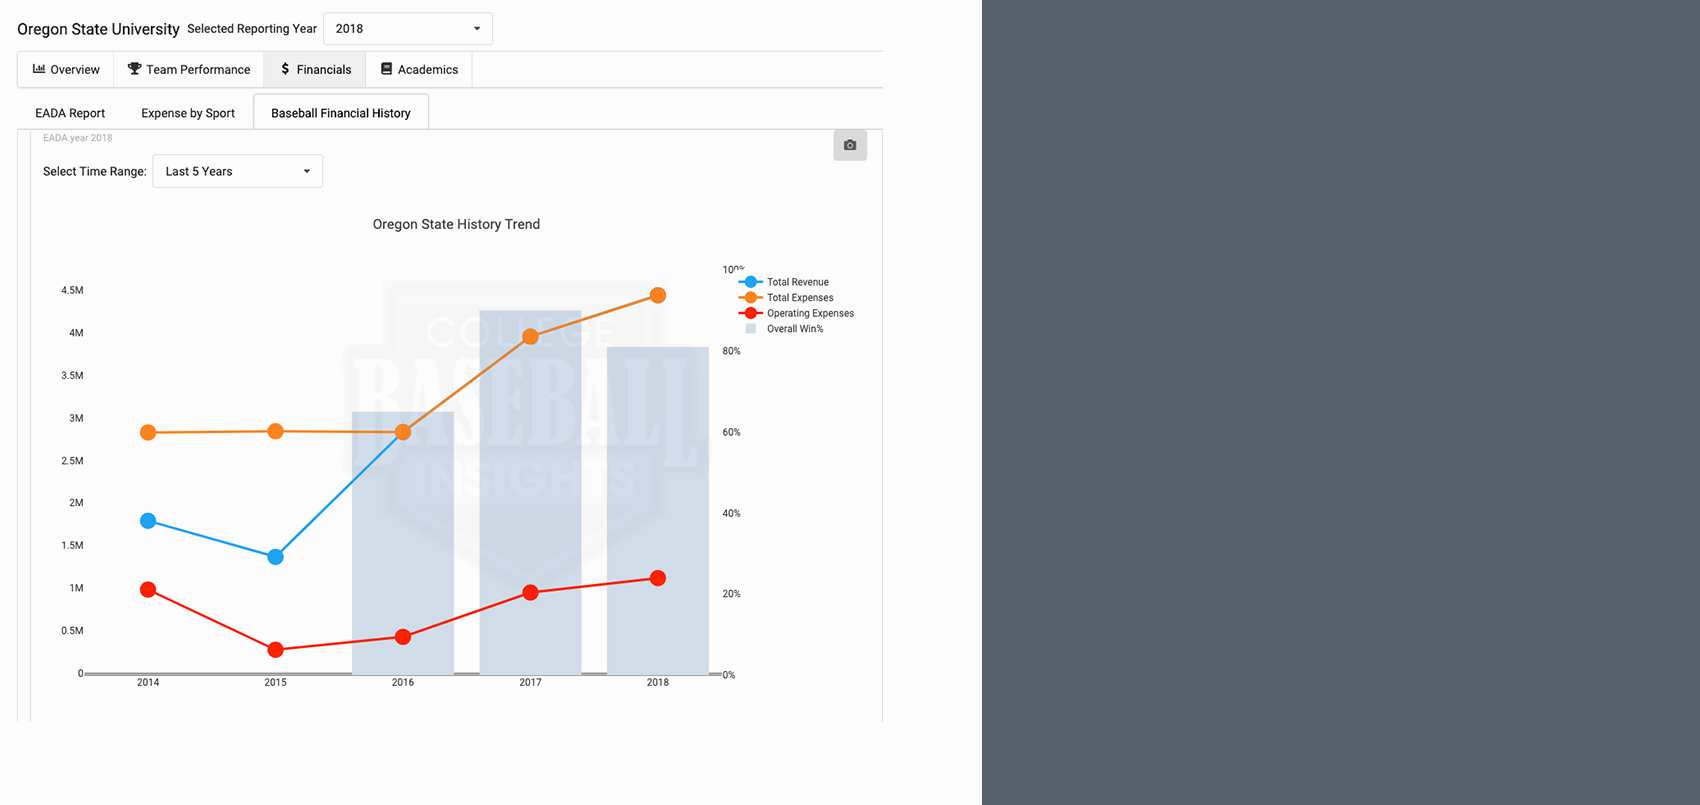
Baseball Financial History
Shows Game Day (Operating Expenses), Total Expenses and Total Revenue
The historical baseball expense trend may be the most important section of the EADA report.. This illustration allows you to track 5 and 10-year allocation trends, making it possible to better determine a school’s ongoing financial commitment to its baseball program.

General Information about a School
Provides general information and link to school website.
Tentative availability of school profile details, Q2 2019.

College Admission Test Requirements
SAT and ACT Score Ranges
In providing SAT and ACT score ranges as well as college acceptance rates, we give you an idea of whether you are likely to be favorably considered for admission at the school of your choice. While some schools make exceptions for lower standardized scores in favor of a higher GPA and other considerations, it makes sense to look at schools that are within your specified range.

School Map
Our Quick Tour is not currently available for mobile use.
