What is EADA and What Do You Need to Know?

If you’re a high school baseball player, all you know is that you want to play baseball at the next level.
You do your research about what schools you want to play at, how their roster breaks down and if you’re going to have a chance to play early on in your career. But, one of the most important things to look into when doing research about a college is its EADA Compliance report.
So what is EADA?
The Equity in Athletics Disclosure Act, or EADA for short, is an act that states a college must disclose information about all their varsity sports teams and the financial resources and personnel that the school dedicates to each of those teams.
The act was designed to make prospective student-athletes aware of a university’s commitment to providing equal athletic opportunities for its men and women students. The act also is in place to provide a way to determine if schools that receive federal money treat student-athletes equally. The EADA Report must be published by October 15 each year and must be made available upon request to prospective students and the public.
As a potential player, you may think that this report doesn’t really concern you, but there is some very important information that comes out of this report that you want to look into when researching a program.
You want to know how much money the university is allocating to the baseball program, compared to the other sports teams. You want to know if you’re going to a school where baseball is one of the main attractions or if it’s on the backburner compared to all the other sports at a school. You want to be somewhere where the baseball program is cared about and gets enough allocated money to make the program the best it can be.
College Baseball Insights provides insights to these questions and more related to EADA reports:
- Reported Team Roster Size (Team Insights)
- EADA Compliance Reporting
- Expense by Sport
- Historical Budget (5 or 10 years)
Reported Team Roster Size (Team Roster Insights)
In 2020, the University of Louisville website lists 37 players, which is the same number of players that was reported to EADA.
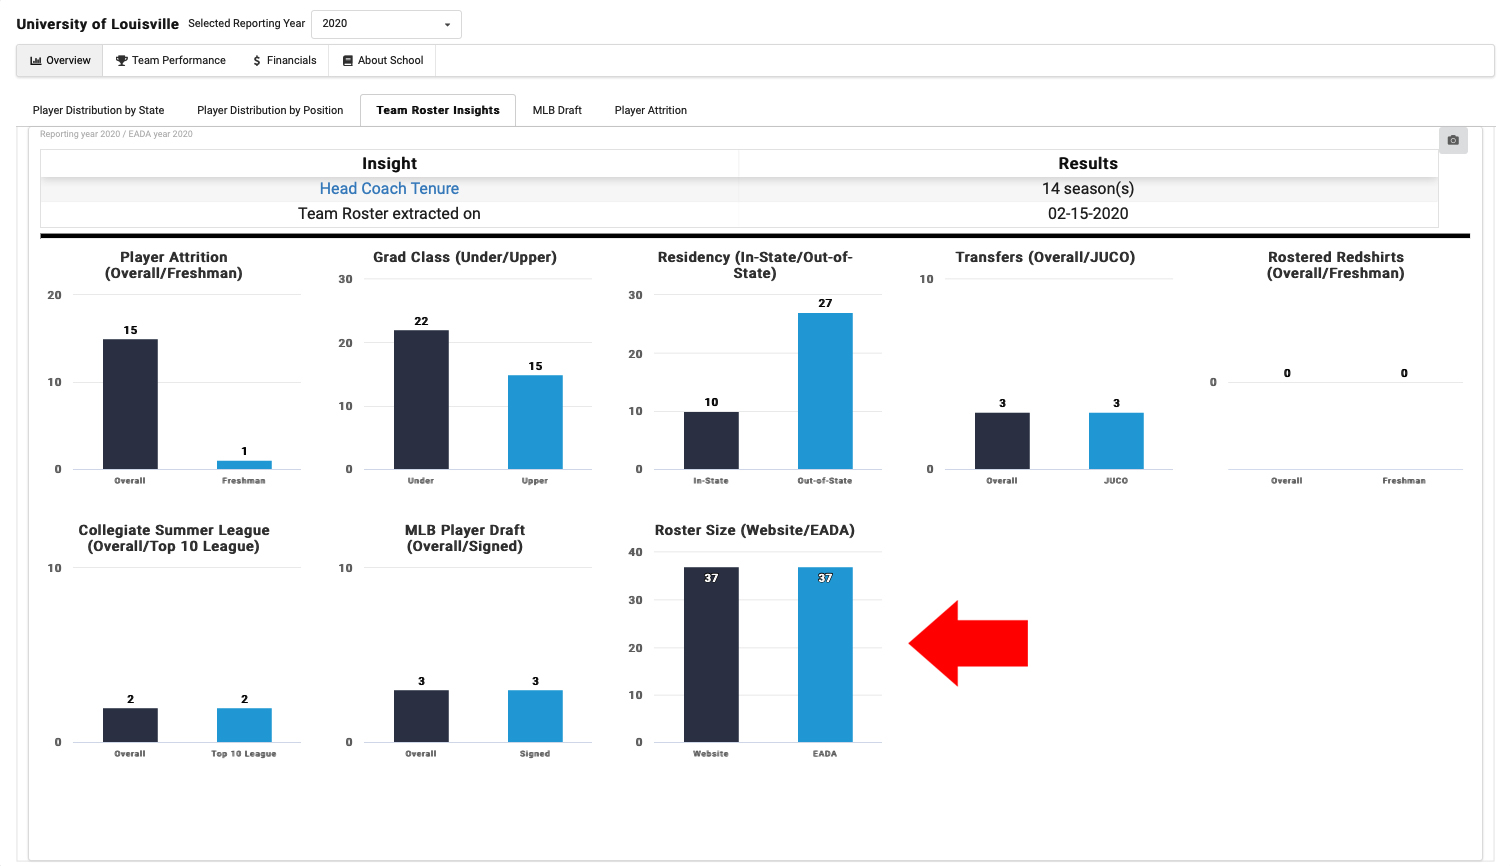
(Louisville College Profile, Team Roster Insights, 2020. Click image to enlarge.)
In 2020, the University of Arkansas website lists 43 players, whereas the actual number of players that participated on the team was 48. The additional players might have been non-rostered players that were redshirted, but they probably practiced with the time at some point during the season.
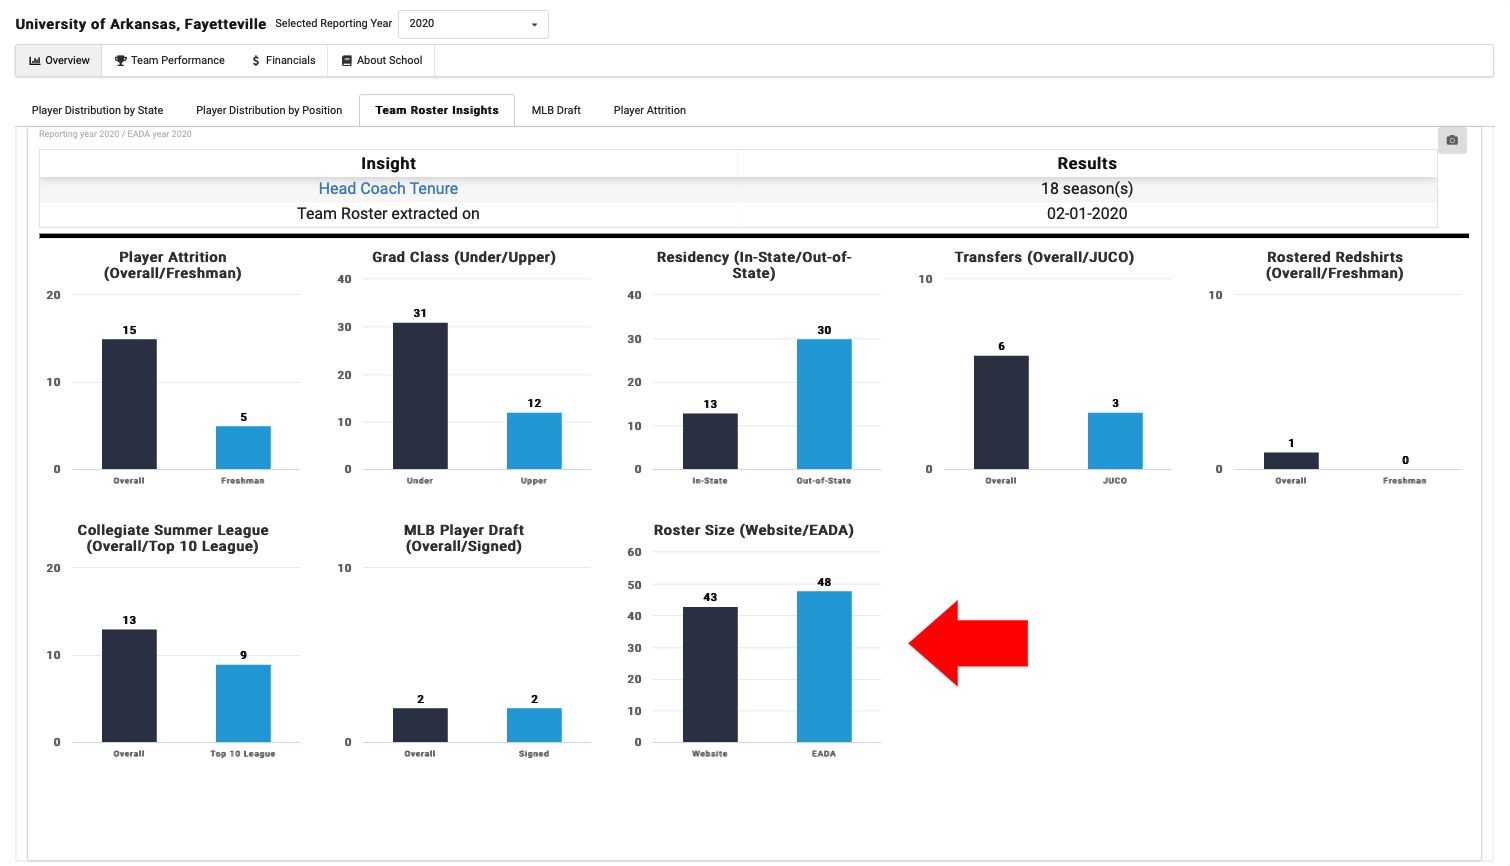
(Arkasas College Profile, Team Roster Insights, 2020. Click image to enlarge.)
One other thing you might notice when looking at EADA reports on College Baseball Insights is that the roster size reported in the yearly EADA can sometimes differ from the roster size that is reported on a team’s official website.
In accordance with EADA, a school must report a player if they meet one of the following criteria’s:
- Listed by the institution on the varsity team’s roster
- Receive athletically related student aid
- Practice with the varsity team and receive coaching from one or more varsity coaches.
Basically what this means is you have to make sure to really do your research on a team beyond the team’s official website. A team’s website might be published for marketing and informing, but it might not reflect the complete status of the team and players, so they might decide not to officially list players who might be redshirting or injured for that season. So if you’re looking a team’s roster you may think you have an opportunity at a position, but then later find out they might’ve had two guys at that position redshirted, and now your competition is that much fiercer.
EADA Compliance Reporting
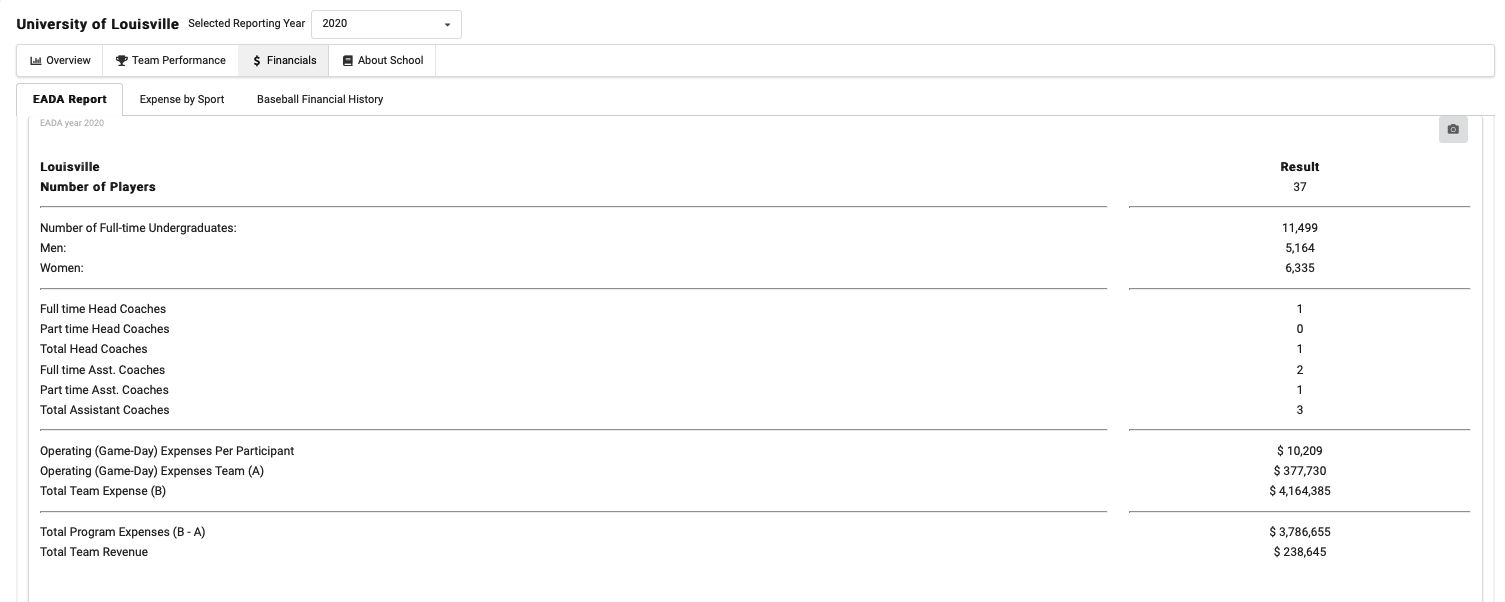
(Louisville College Profile, EADA Report, 2020. Click image to enlarge.)
Also provided in the College Baseball Insights EADA pages for each program is a breakdown of the number of coaches in a program. There will be a breakdown of full time coaches and part time coaches. If a program has a lot of part-time coaches on the staff, there is a chance those coaches might not be around the program for your whole career, as they will always be looking for full-time positions.
Stability among the coaches in a program can be important to a player because those are the guys that recruited you, so if there is a history of turnover in coaches, there may be coaches that come in that don’t like your style as play as much as the coaches that recruited you did. The Head Coaches Experience provides insights as to how long the coach has been tenured at the school
Expense by Sport
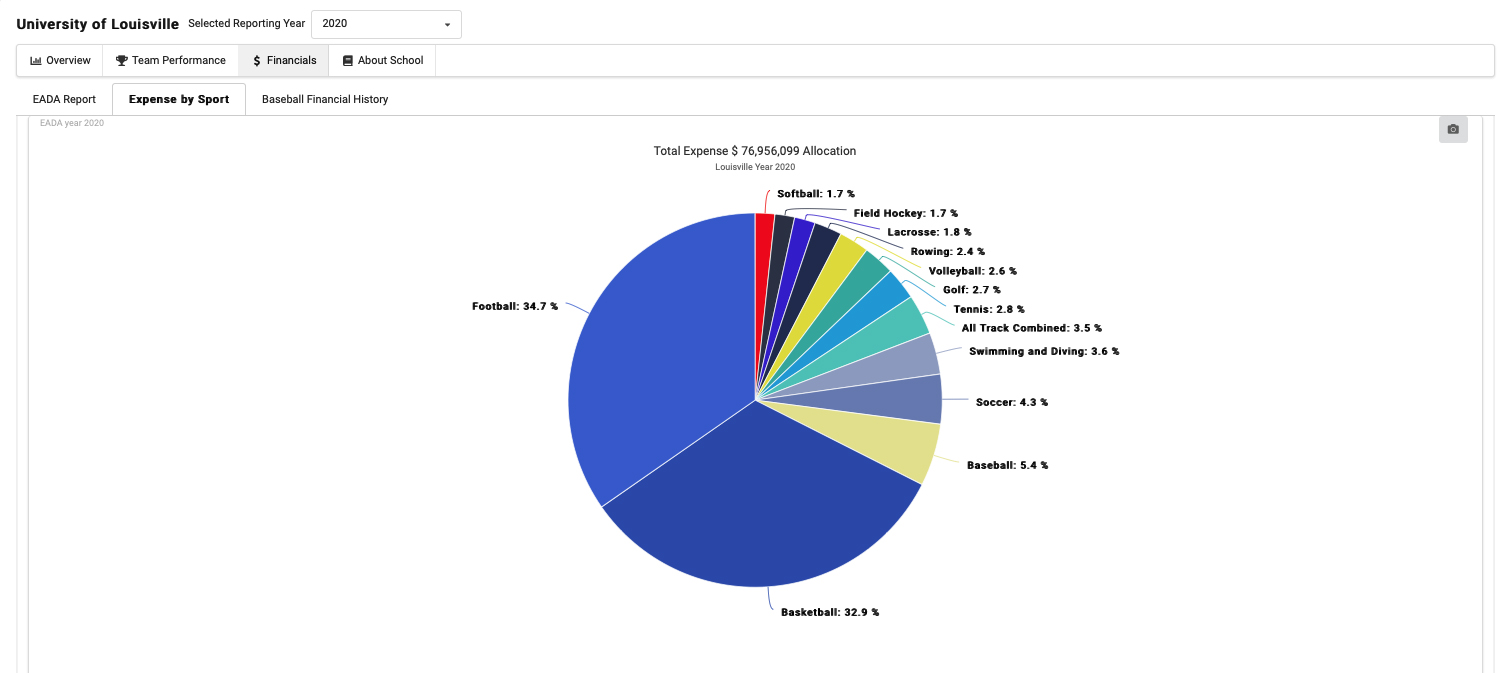
(Louisville College Profile, Expense by Sport, 2020. Click image to enlarge.)
For every school, College Baseball Insights will have a graph displaying how much money a school has to allocate to all of its sports programs and provides a breakdown of the percentage of that money that goes to each sport. There will also be graphs displaying historical trends on a programs total expenses and total revenue.
Total expenses are any expenses that are attributable to athletic activities. This includes appearance guarantees and options, athletically related student aid, contract services, equipment, fundraising activities, operating expenses, promotional activities, recruiting expenses, salaries and benefits, supplies, and travel.
Total revenues are any revenues from appearance guarantees and options, an athletic conference, tournament or bowl games, concessions, contributions from alumni and others, institutional support, program advertising and sales, radio and television, royalties, signage and other sponsorships, sports camps, state or other government support, student activity fees, and ticket and luxury box sales.
Historical Budget (5 or 10 years)
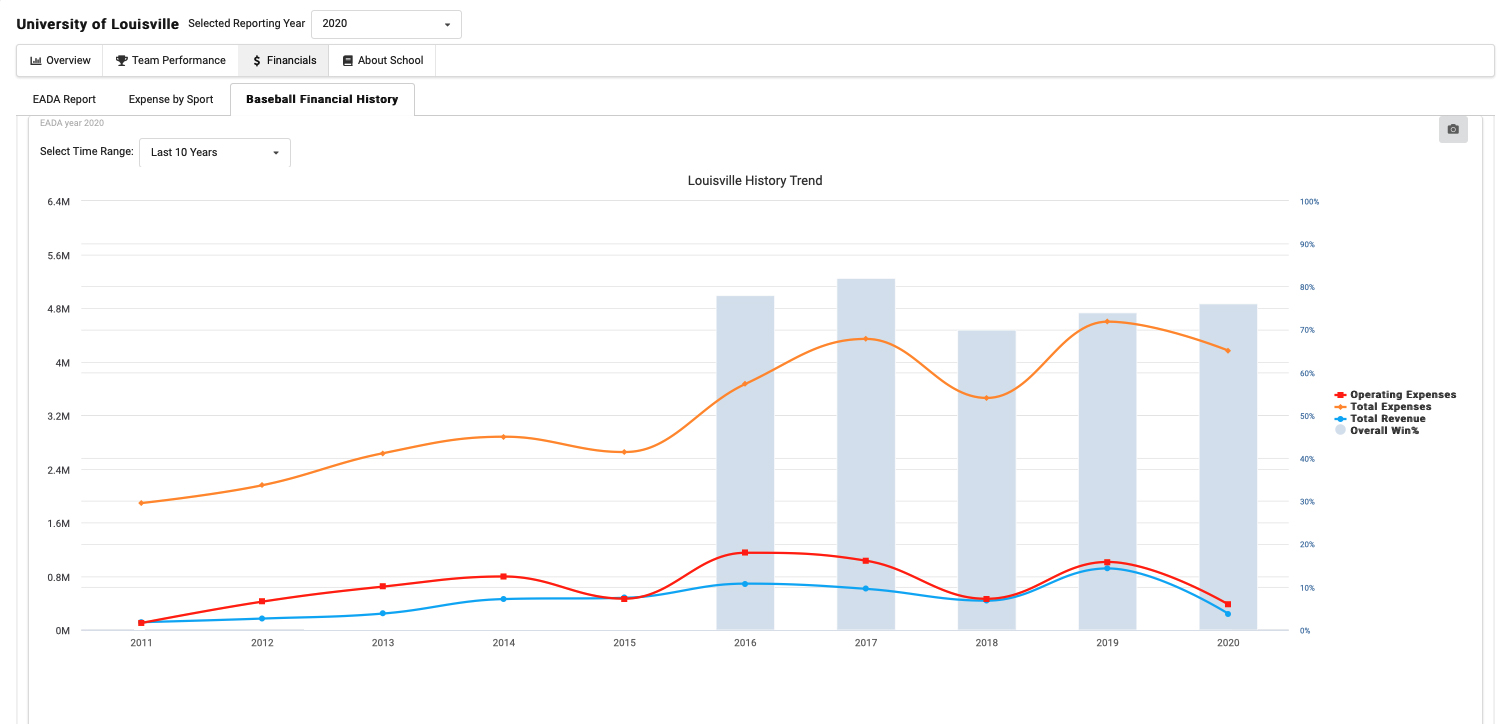
(Louisville College Profile, Expense by Sport, 2020. Click image to enlarge.)
Each school will have this graph that shows its total revenue, total expenses, and Operating expenses over a certain number of years. As you can see in the graph above for Oregon State University, over the last couple of years there has been a big spike in their total revenue and total expenses. The team has become very successful so their bringing in a lot more money as a program and it shows with the success they have a lot of expenses to keep up with as well. But, this is the kind of progression that you want to see in a program, you might not want to get involved in a program where their expenses are going up at a way higher rate than their revenue because that program could be spending money on the wrong things.