How Alumni Placement Score (APS) Works — 2026 Methodology

How Alumni Placement Score (APS) Works — 2026 Methodology
A simple alumni headcount treats every roster spot the same, whether it’s on an NCAA Division I team or an NCCAA team — and that undersells programs whose alumni are placing at higher competitive levels.
Raw Alumni Placement Score (APS) is CBI’s answer: each alumnus currently active on a four-year roster is weighted by that roster’s level, and Raw APS is the sum of those weighted values.
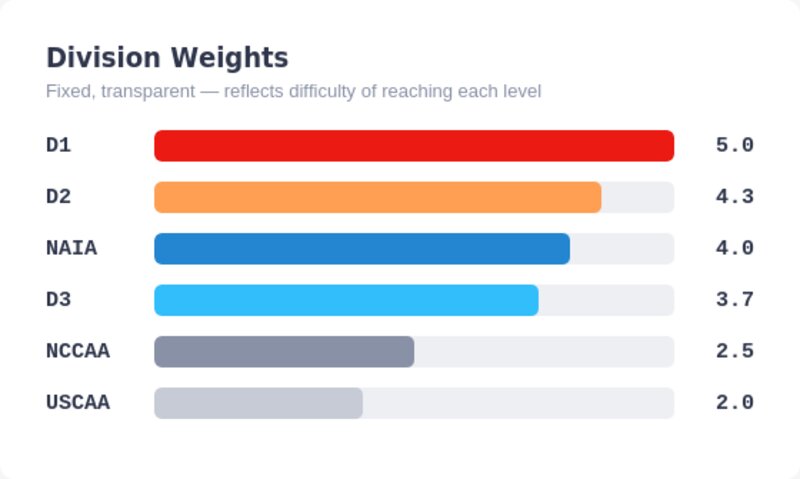
Raw APS is the primary ranking metric on any leaderboard using this model, replacing simple alumni headcount. Efficiency APS is Raw APS divided by a program’s total alumni count, showing placement quality per alumnus independent of program size; it’s displayed for context but does not affect the ranking order. Total alumni remains visible as its own column on every board, highlighted alongside Raw APS as the two metrics readers look to first. When two or more colleges have the same Raw APS, the higher total alumni count breaks the tie; if total alumni is also equal, win percentage is the second-level tiebreaker. These weights are a first version of the model — CBI expects to refine them as more data becomes available.
An Annual Snapshot, Not a Transfer History
These counts are an annual snapshot, updated as alumni move levels year to year (JUCO to D2, then D2 to D1, for example) — not a full transfer history. A player’s tracked level reflects where they’re playing right now, at the time of each reporting period, which is not always the same as where the JUCO program originally placed them. See the FAQ below for what “placement” specifically means in this context.
What Win-Loss Record and Win Percentage Do (and Don’t) Tell You
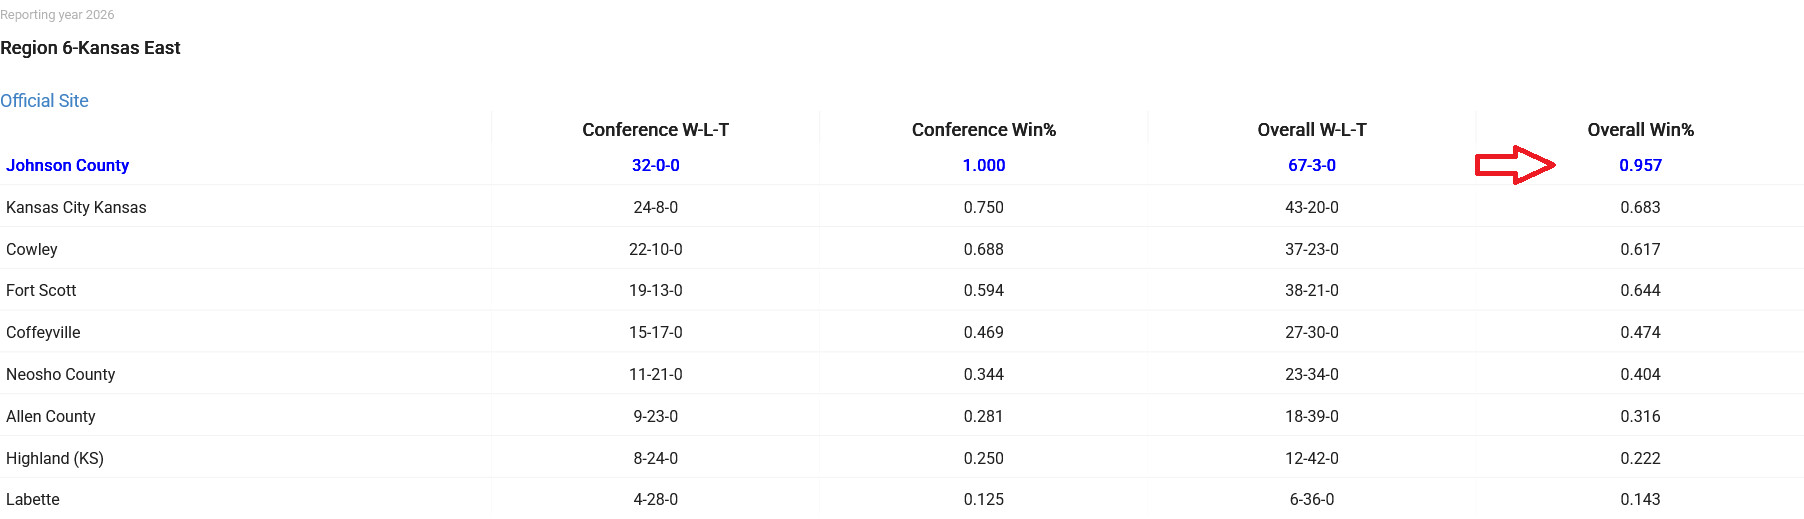
Win-loss record and win percentage are shown for context about a program’s current season and serve as the second-level tiebreaker — used only when two or more colleges are tied on both Raw APS and total alumni. They reflect how a team is performing on the field this year — a program that is winning now is still producing on the field, but that is not a guarantee about the success of a future transfer class. Raw APS and Efficiency APS are about placement outcomes for alumni already in four-year programs; win percentage is a separate, current-season signal, not a predictor of what a team’s next graduating class will do.
Reading Raw APS, Win Percentage & Coach Tenure Together
Raw APS, win percentage, and head coach tenure run on three different timelines — a multi-year placement record, a single season, and a career at one program. CBI is the first to put all three together on a single board, and understanding how they interact is what turns three numbers into a real read on where a program stands.
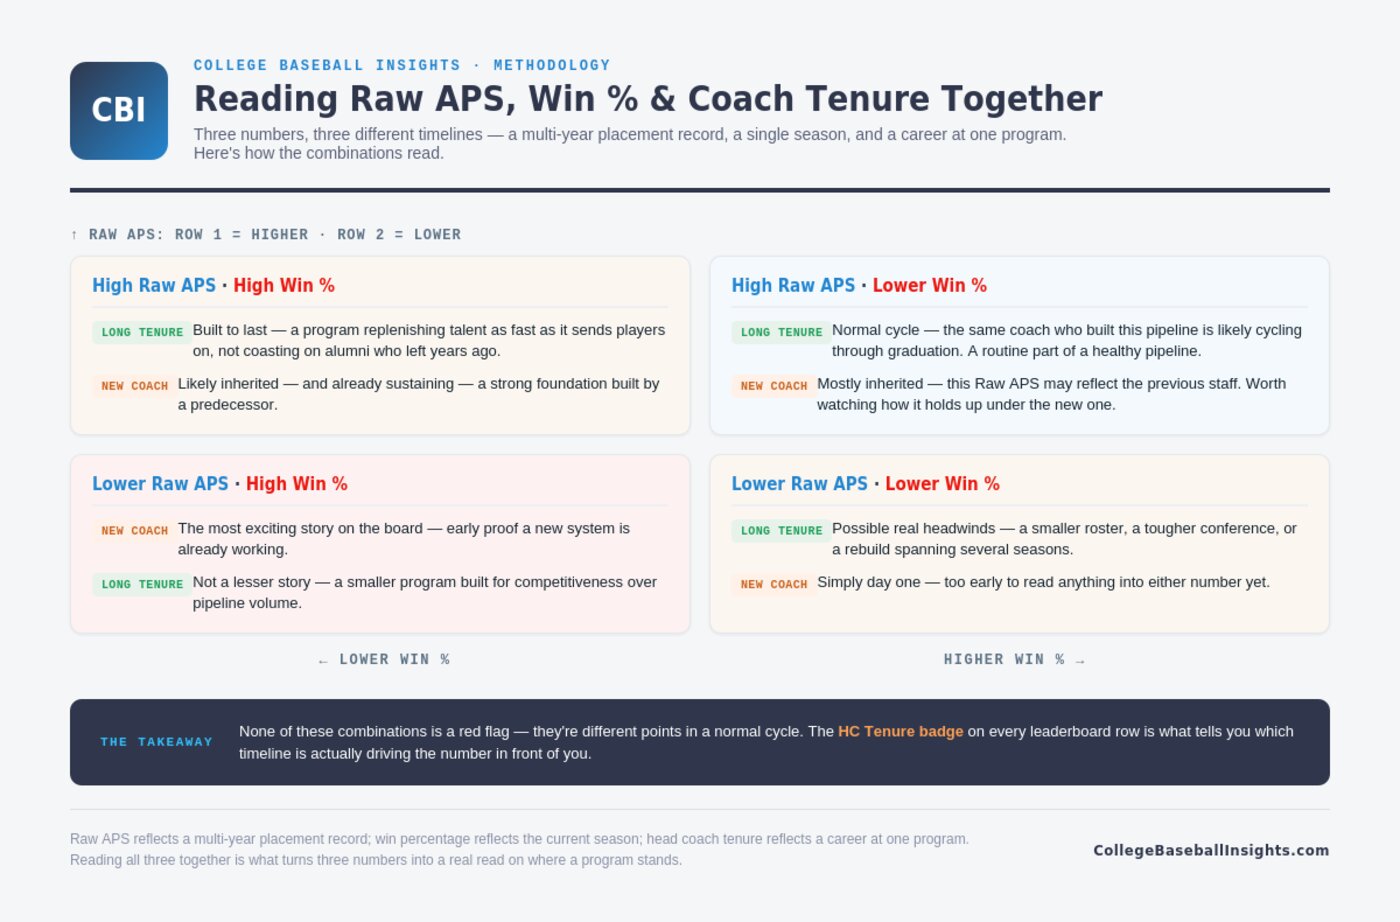
When a program leads in both Raw APS and win percentage, check the HC Tenure badge before drawing a conclusion. Under a long-tenured coach, that combination is a program built to last — proof it’s replenishing talent as fast as it sends players on, not coasting on alumni who left years ago. Under a coach in their first year or two, it more likely means they inherited — and are already sustaining — a strong foundation built by a predecessor.
When a program has a strong Raw APS but a quieter season, tenure tells you whether that’s a normal cycle or a bigger shift. If it’s the same coach who built the placement record, the roster is likely cycling through graduation — a routine part of a healthy pipeline. If a new coach just arrived, that Raw APS may be largely inherited, and it’s worth watching how it holds up under the new staff.
When a program has a lower Raw APS but a strong current win percentage, a first-year coach in that spot is the more exciting story — early proof a new system is already working. A longer-tenured coach in the same spot may simply be running a smaller program built for competitiveness over volume, which isn’t a lesser story, just a different one.
When a program is early in both — lower Raw APS and a quieter season — a new coach means this is simply day one. A longer-tenured coach in that position may reflect real headwinds: a smaller roster, a tougher conference, or a rebuild spanning several seasons.
None of these combinations is a red flag. They’re different points in a normal cycle, and the HC Tenure badge on every leaderboard row is what tells you which timeline is actually driving the number in front of you.
Use Cases: Seeing the Model in Action
The formula above is straightforward on its own. Applied to real programs, it starts to show why Raw APS and Efficiency APS tell a fuller story than either a win-loss record or a simple alumni headcount ever could.
Use Case 1: Calculating a Program’s Raw APS
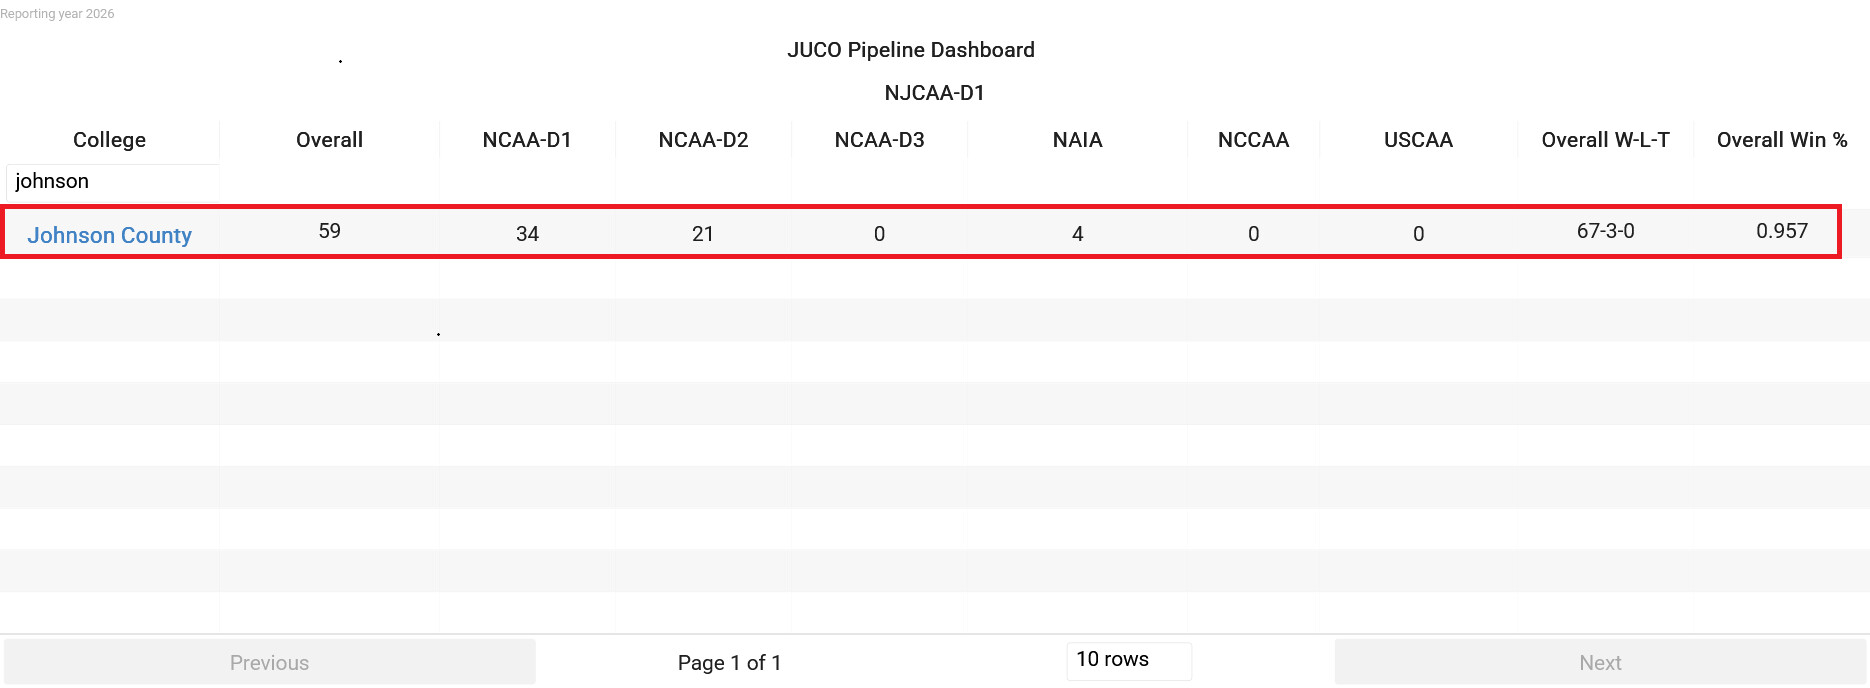
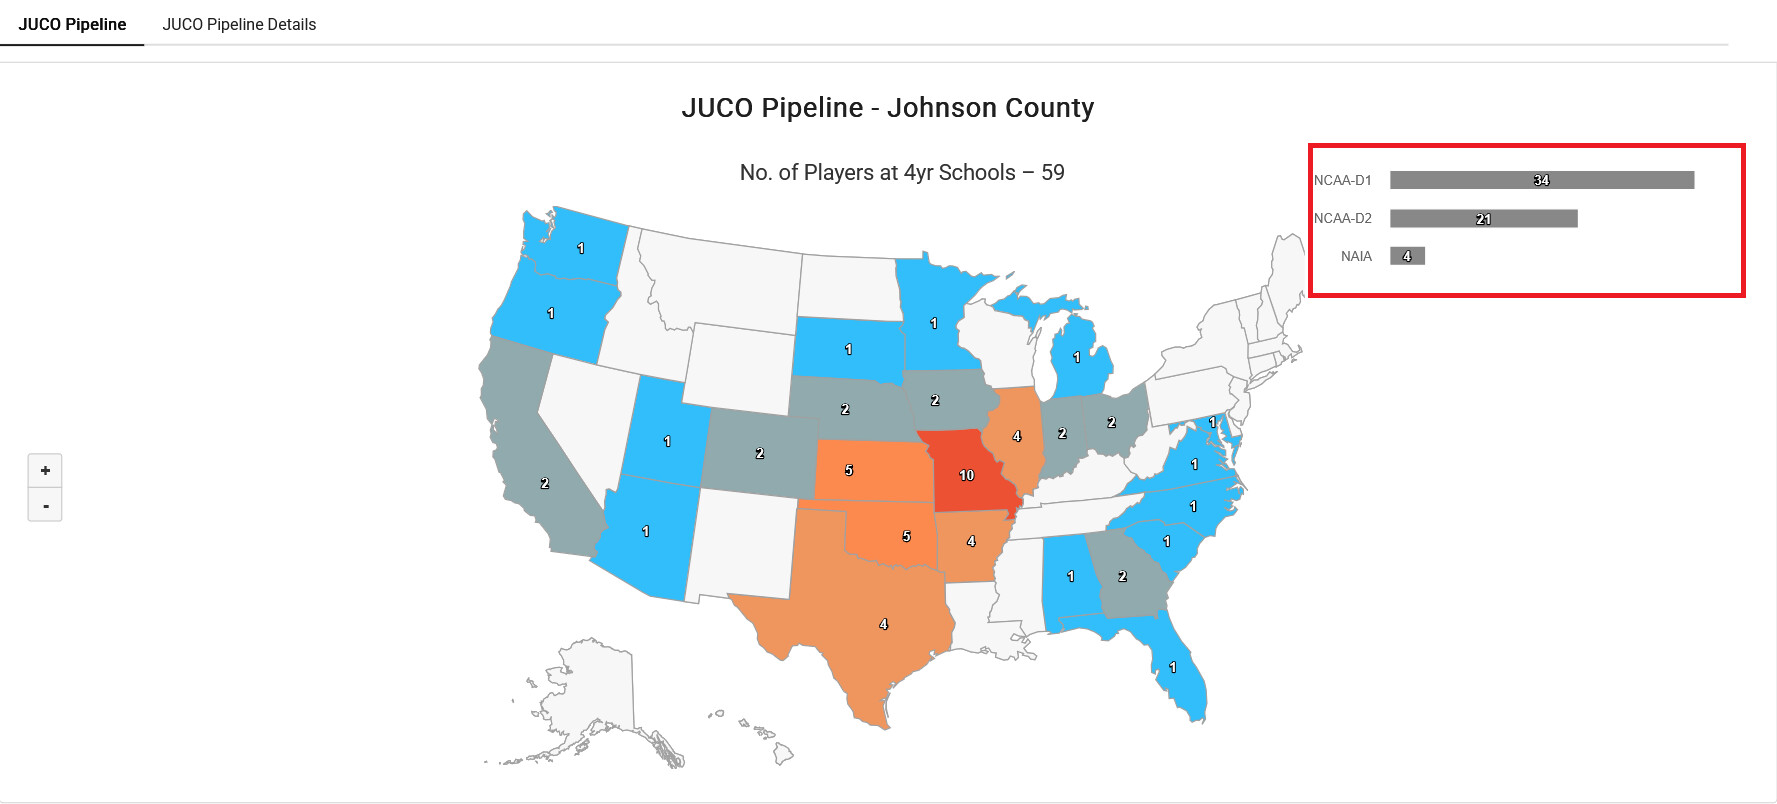
Johnson County currently has 59 alumni active on four-year rosters: 34 at NCAA Division I, 21 at NCAA Division II, and 4 at NAIA.
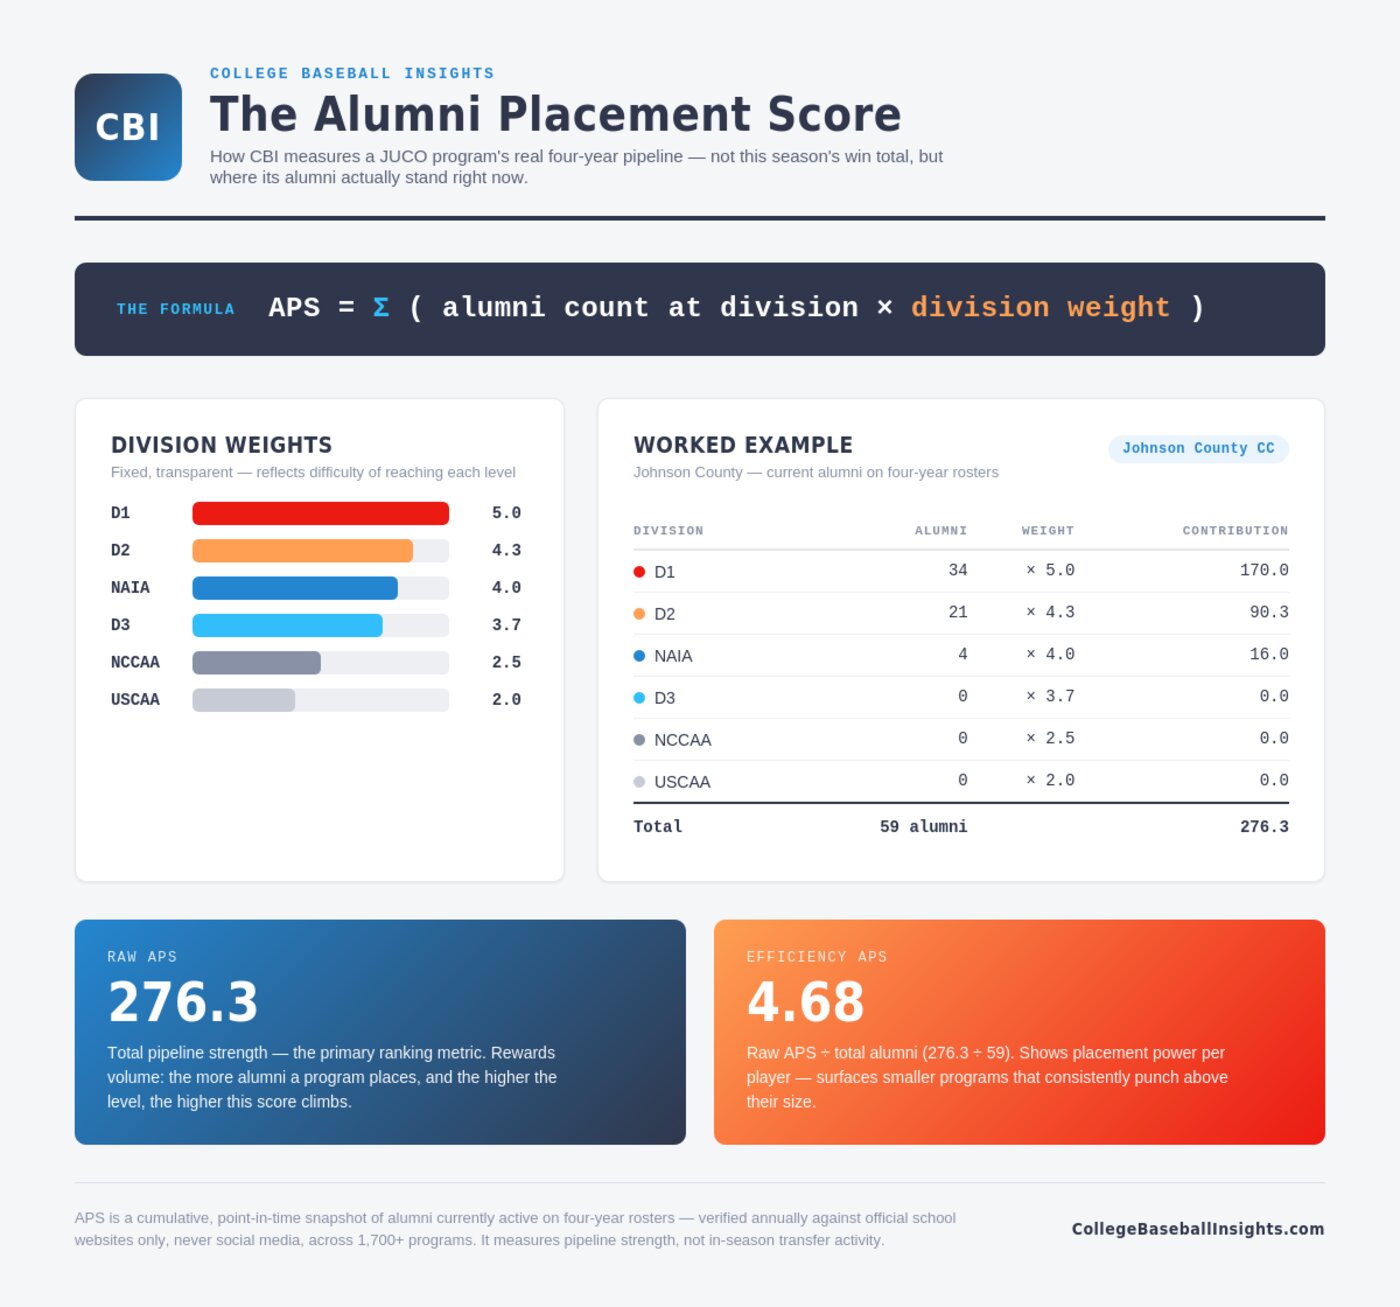
Efficiency APS = 276.3 ÷ 59 = 4.68.
What this identifies: the mechanics of the formula in isolation — how a program’s alumni translate into a single weighted score, and how Efficiency APS is derived from it. It’s the baseline arithmetic every other leaderboard number is built from.
Use Case 2: Why Raw APS Can Tell a Different Story Than a Simple Alumni Count
Kirkwood has 43 total alumni on four-year rosters. Sacramento City has 34. On a simple headcount, Kirkwood’s pipeline looks clearly stronger — a nine-player gap.
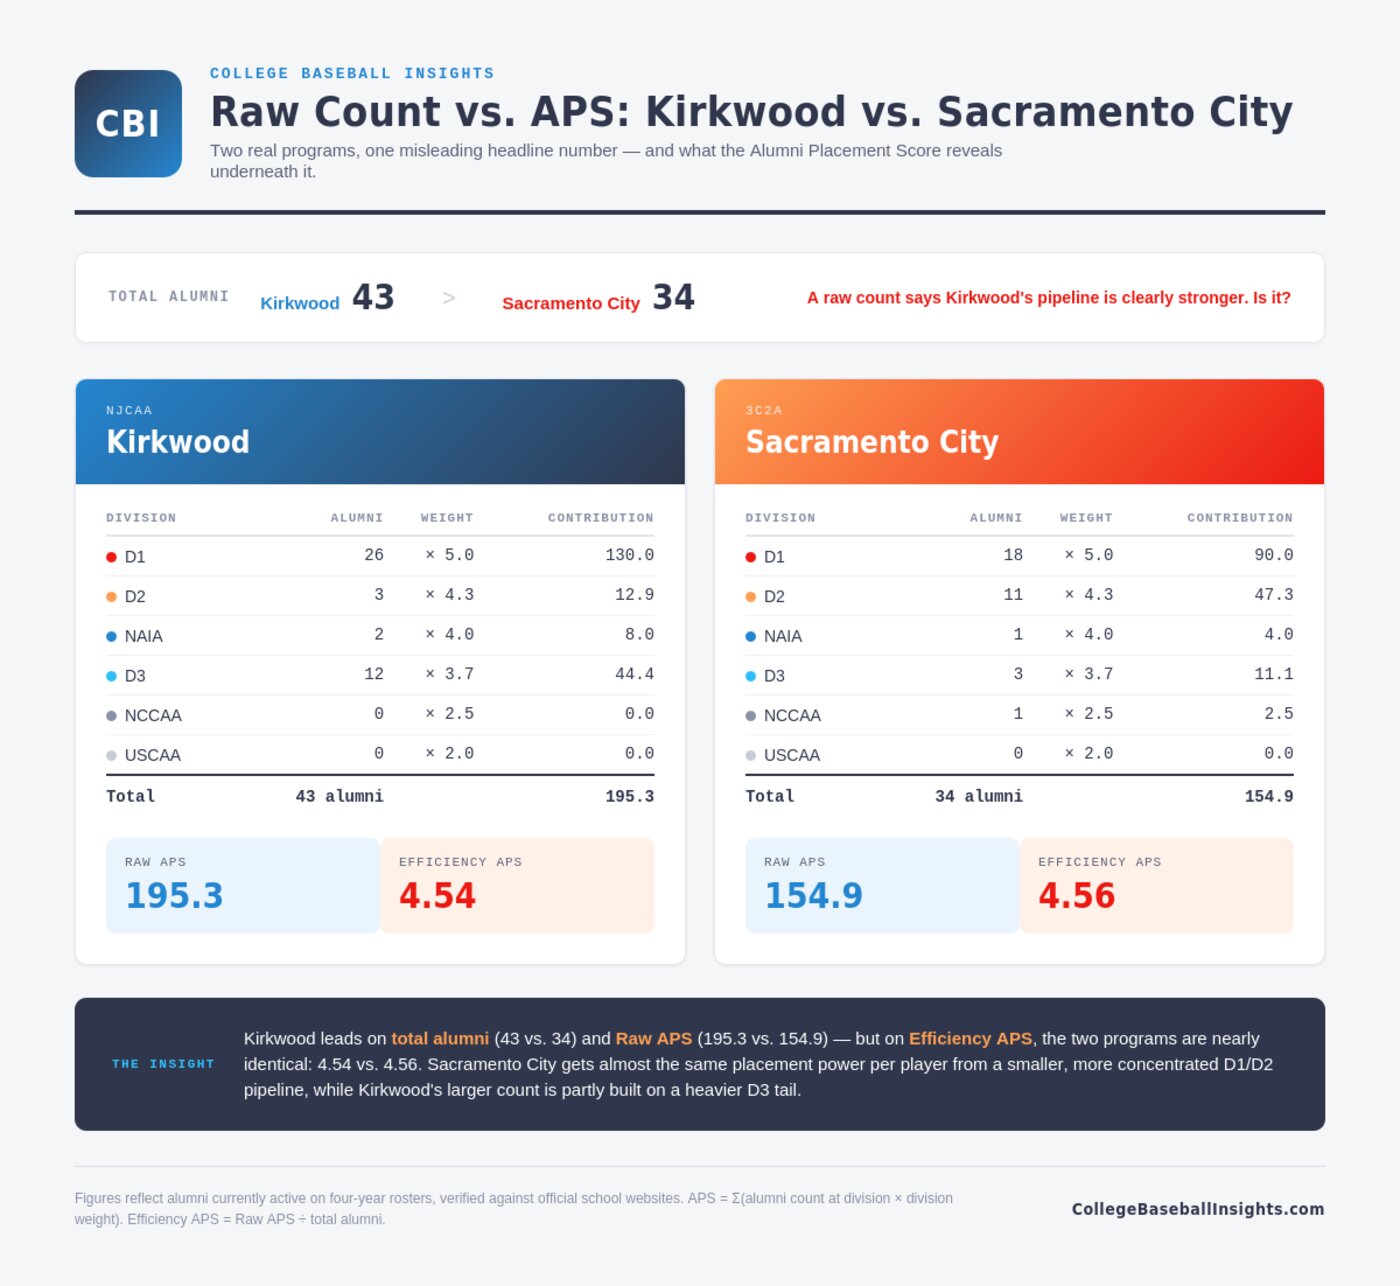
Kirkwood still leads on total alumni and Raw APS — a larger pipeline is a larger pipeline. But Efficiency APS is nearly identical between the two programs: 4.54 versus 4.56. Sacramento City is generating almost the same placement power per alumnus from a smaller class, with a higher share of its alumni concentrated at NCAA D1 and D2. A meaningful share of Kirkwood’s larger total comes from NCAA D3 placements, which the model weights lower.
What this identifies: the specific limitation of judging a program by alumni count alone, and what Efficiency APS is for. A raw headcount can’t distinguish a program with a lot of alumni spread across lower-weighted divisions from one with fewer alumni concentrated at higher levels. Raw APS starts to separate the two; Efficiency APS makes the distinction explicit.
Try It Yourself: APS Calculator
Add up to 5 schools and enter each one’s current alumni count per division, win percentage, and head coach tenure. Raw APS, Efficiency APS, and an APS Read calculate instantly for every school, and the Comparison Report ranks them side by side — using the same weights and logic as the rest of this page.
Need the Full Data?
These pages are part of CBI’s subscriber platform — get full access to pull the exact numbers for any program.
Raw APS = Σ (alumni count at division × division weight) · Efficiency APS = Raw APS ÷ Total Alumni
Download the same calculator as an Excel workbook — compare up to 5 schools with the identical Raw APS, Efficiency APS, and APS Read formulas used above, plus built-in comparison charts.
Frequently Asked Questions
What does “placement” mean in Alumni Placement Score?
Alumni Placement Score reflects where an alumnus is playing right now, as of the current reporting period — not necessarily the specific four-year program the JUCO directly sent them to. A JUCO program’s most direct, attributable contribution is the initial transfer: helping a player move from the JUCO ranks onto a four-year roster for the first time. If that same alumnus later transfers again — from one four-year program to another — that subsequent move reflects the player’s own career path more than continued involvement from the original JUCO program. Raw APS counts alumni at their current level regardless of how many transfers happened after the initial JUCO placement, so it’s best read as a snapshot of where JUCO alumni collectively stand today, not a strict record of each program’s direct placement outcomes.
What is Raw APS?
Raw APS is the sum of a program’s alumni counts at each four-year division, with each division weighted by competitive level (NCAA Division I = 5.0 down to USCAA = 2.0). It’s the primary sort metric on CBI leaderboards using this model.
What is Efficiency APS?
Efficiency APS is Raw APS divided by a program’s total alumni count. It shows placement quality per alumnus, independent of program size, so a smaller program can still post a high Efficiency APS even if its Raw APS ranks lower. It’s shown for context and doesn’t affect ranking order.
How are ties broken when two colleges have the same Raw APS?
Total alumni is the first tiebreaker — the college with more total alumni currently active on four-year rosters ranks higher. If both Raw APS and Overall are tied, win percentage is the second-level tiebreaker. Exact Raw APS ties are rare; when they do happen, this order reflects that a program placing the same weighted value across more total alumni demonstrates comparable quality with greater depth.
Why these specific weights?
The current weights are a first version of the model, reflecting a general ordering of competitive level across NCAA Division I, II, and III, NAIA, NCCAA, and USCAA. CBI expects to refine these weights as more data becomes available.
Does the division-level breakdown appear on the public leaderboards?
No. The underlying breakdown of alumni by division is used to calculate Raw APS and Efficiency APS but isn’t shown as its own column. Total alumni stays visible on every board.
Does a strong win percentage mean a program will produce a successful transfer class?
No. Win percentage reflects how a team is performing on the field this season and is used only as the second-level tiebreaker — when two or more colleges are tied on both Raw APS and total alumni. It’s a current-season signal, not a prediction of future placement outcomes for that program’s next class of transfers.
What is the HC Tenure badge?
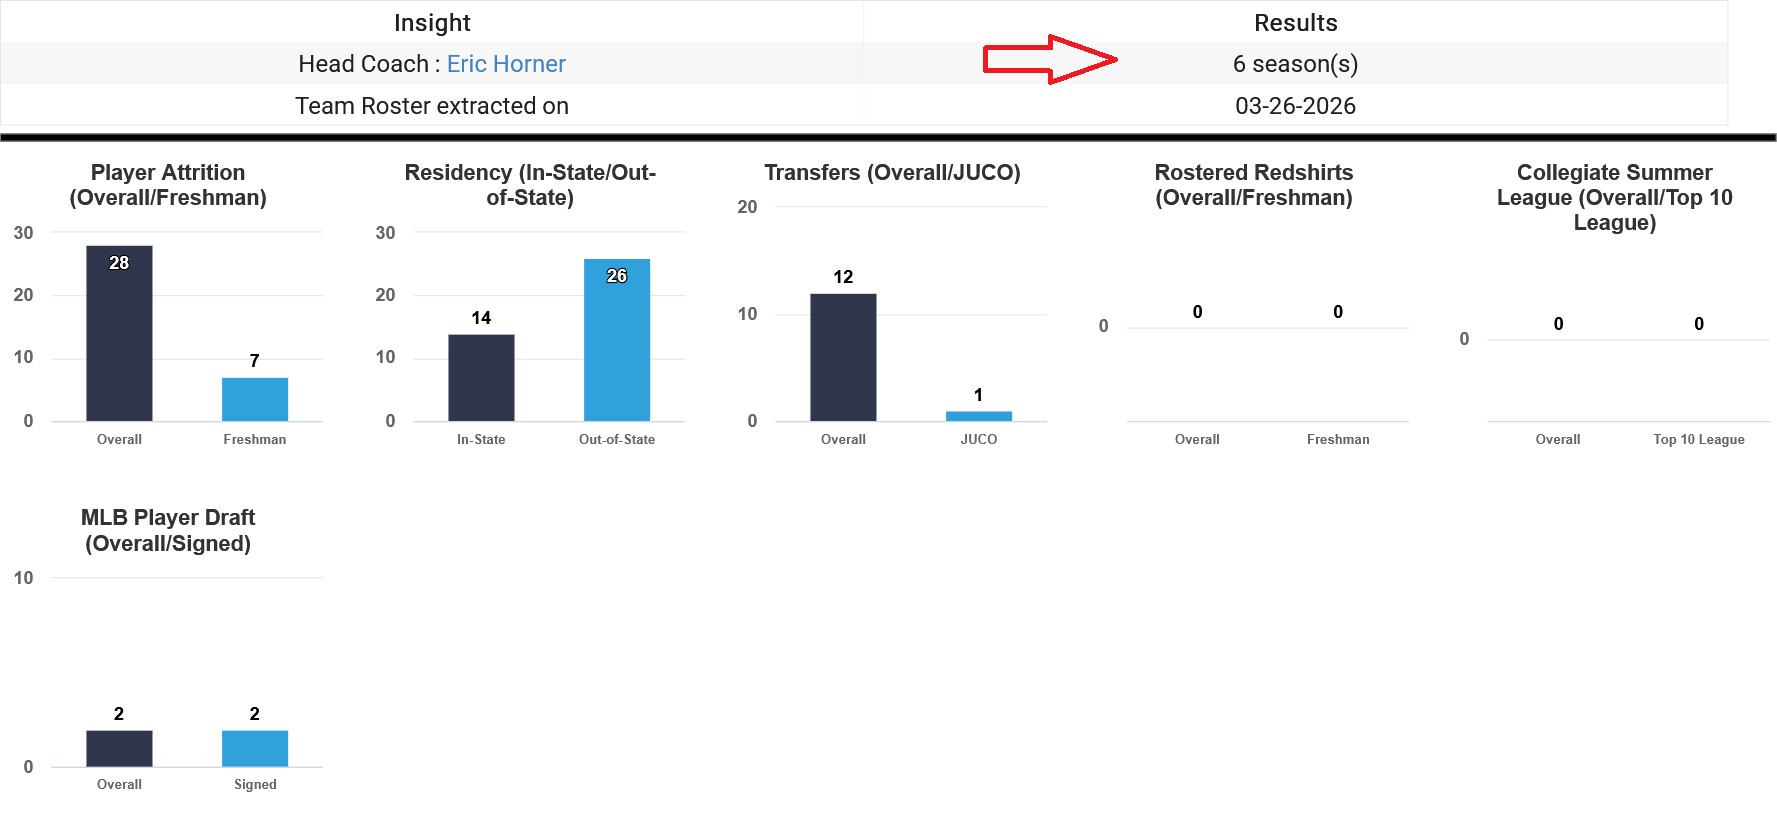
Every college on every CBI leaderboard shows a small badge with its head coach’s name and tenure — an ongoing season count (e.g., “Ken Jacome · 8th season, since 2019”) or a first-year flag — with a link through to the coach’s page on the school’s own athletics website. It’s the context that tells you whether a program’s Raw APS and win percentage reflect a single coaching staff’s work over time or a newer arrival still building their own record. Showing the coach’s name also means anyone who knows a program can spot an outdated record faster than an anonymous tenure count would allow.
What does it mean when a program leads in both Raw APS and win percentage?
Check HC Tenure first. Under a long-tenured coach, it’s a program built to last. Under a coach in year one or two, it likely means they inherited — and are already sustaining — a strong foundation.
What does it mean when Raw APS and win percentage point to different programs?
It depends on tenure. If the same coach built a strong Raw APS that isn’t matched by this season’s win percentage, the roster is likely cycling through graduation. If a new coach just arrived on a strong-Raw-APS program, that number may be mostly inherited. And a first-year coach posting a strong win percentage on a lower-Raw-APS program is often the most exciting story on the board — early proof a new system is working.
A Dated, Versioned Methodology
This page documents the Alumni Placement Score methodology as applied to the 2026 reporting year. If CBI updates the weights or formula in a future season, a new dated methodology page will be published rather than overwriting this one — each season’s leaderboards will continue linking to the specific methodology that was in effect when those rankings were calculated.
Explore more NJCAA rankings: All-Regions Summary · Top 25 · D1 Top 20 · D2 Top 20 · D3 Top 10
Explore more 3C2A rankings: All Conferences · Top 10
Explore more NWAC rankings: Region Rankings · Top 5
Insights reflect data available at time of publication and are subject to change.