State Participation Insights Overview
Have you ever wondered how many student-athletes from your state play college baseball?
Let College Baseball Insights answer that for you!
- Imagine if you could find out how many Freshmen Right Handed Pitchers are playing NCAA-D1 in the current school year? How about last 3 years?
- Interested in understanding the breakdown by Division or Conference? What about Primary Position?
- What are the 4 year High School Participation Statistics for your state?
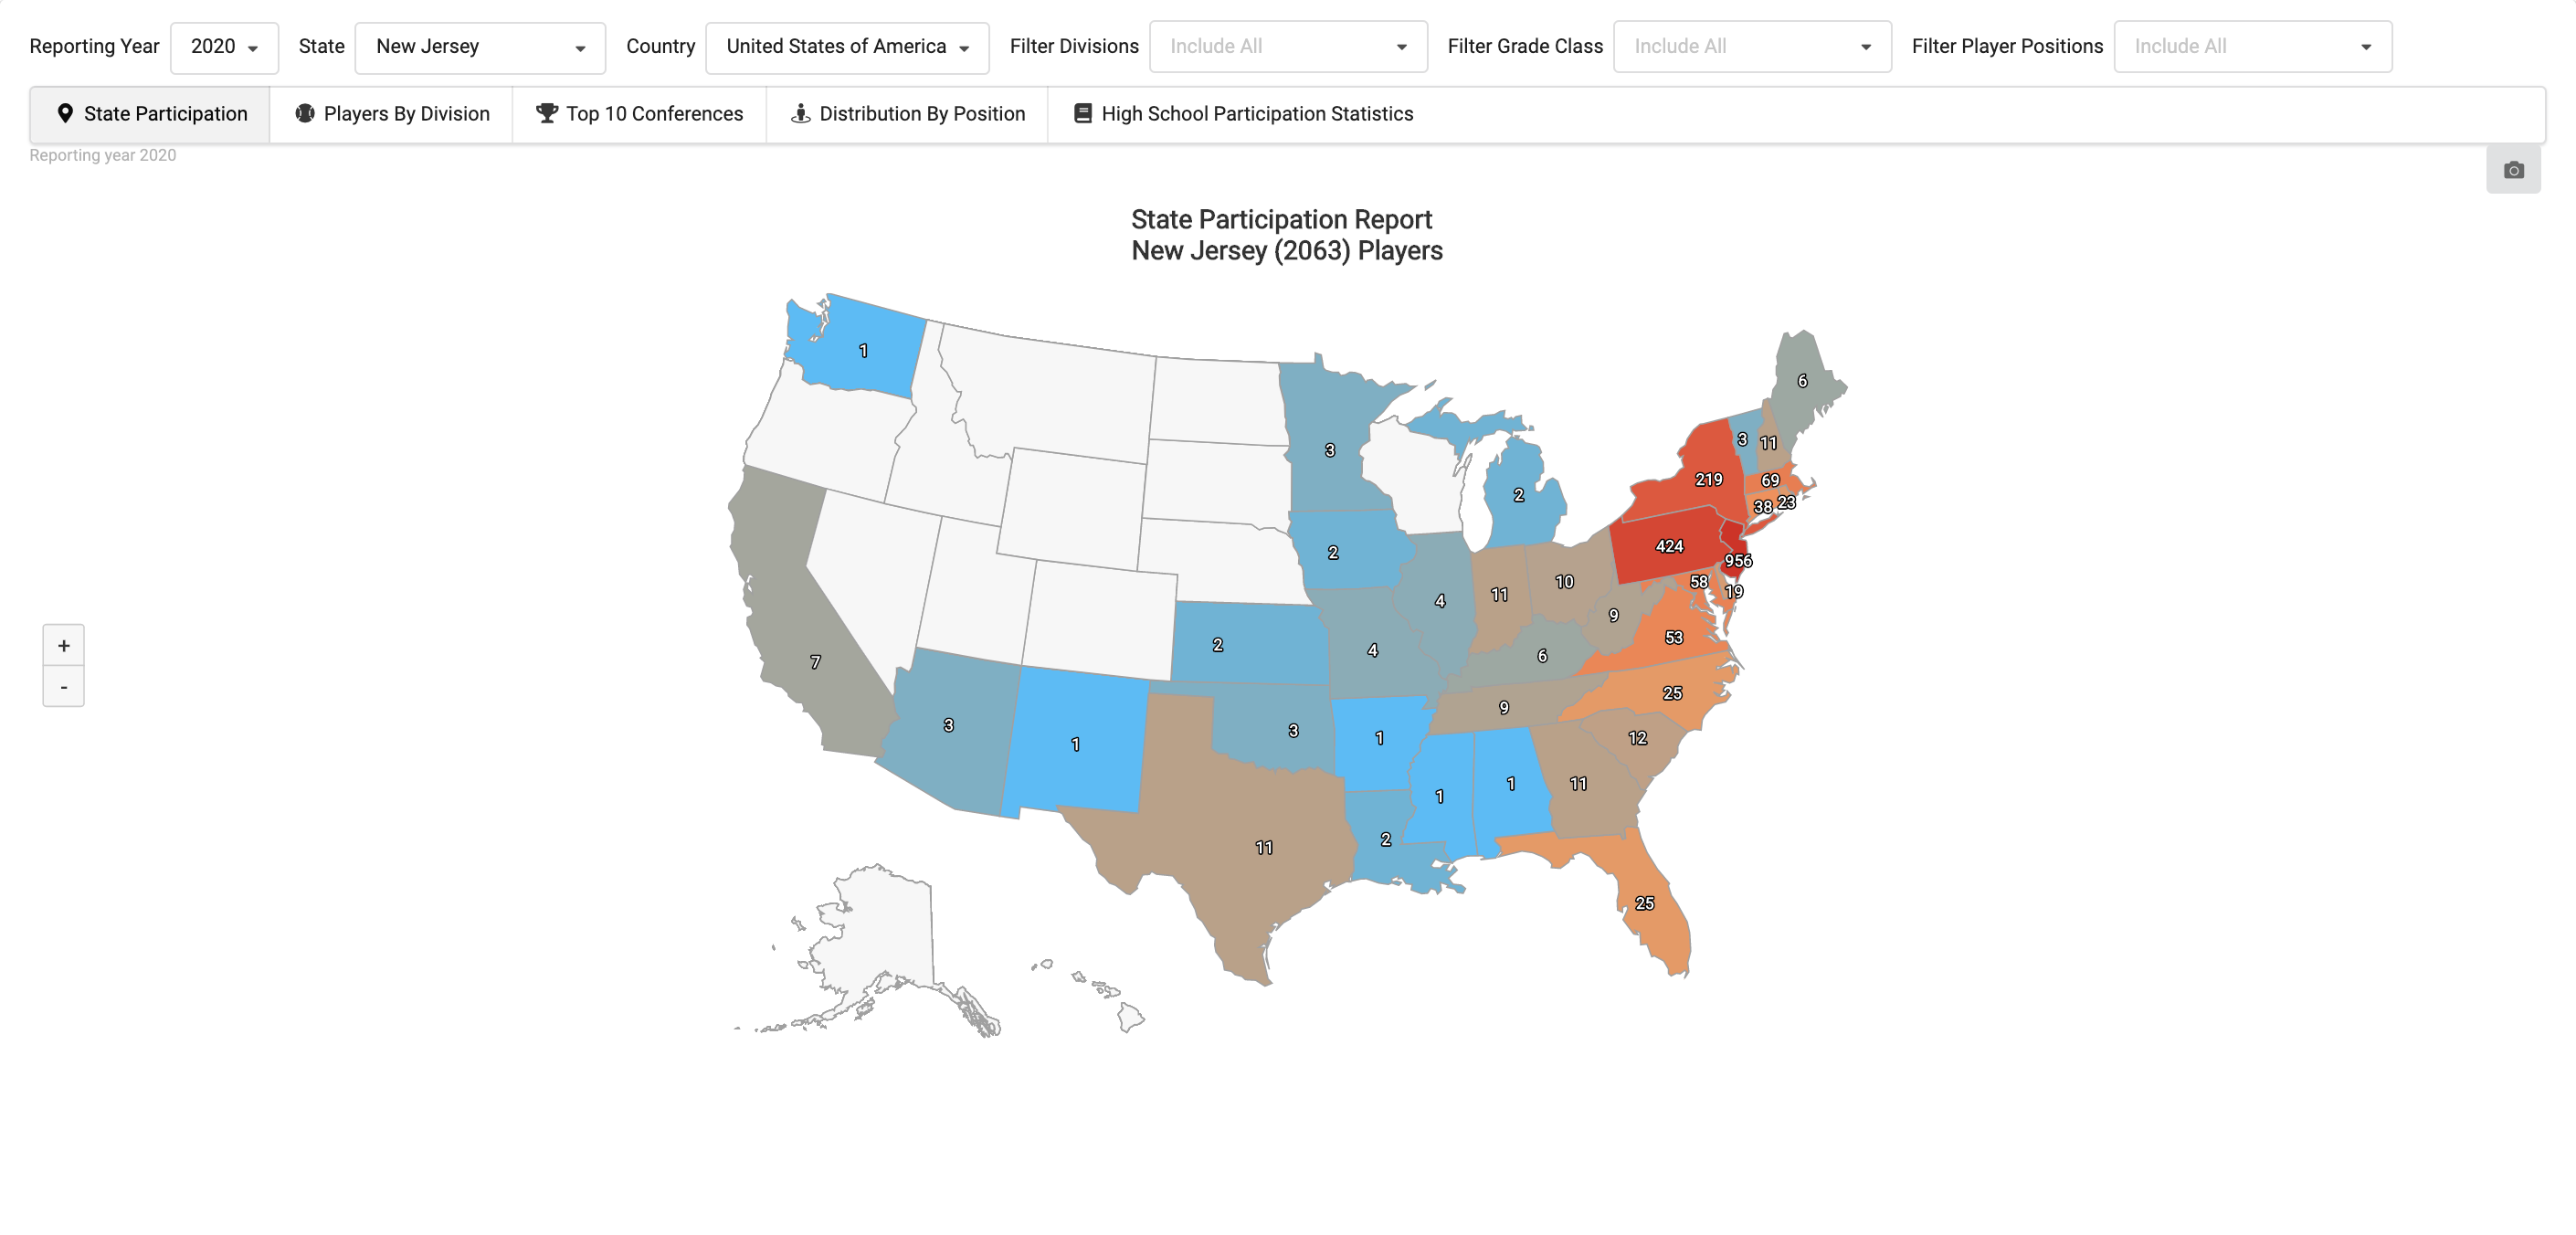
State Participation
With a College Baseball Insights membership, the State Participation Insights allows you to filter by Division, Graduation Class and Player’s Primary Position to quickly visualize state demographic questions.
Why is this information relevant?
If you are looking to play at a certain out-of-state school, but they don’t have a history of recruiting in your area, that doesn’t mean you can’t play there, it just means you have to decide whether you want to put in the extra work and substantial costs to get noticed by that specific school and coach.
“As a parent, you are forced to make tough choices on how to spend your money. You want your son to be happy and have the best opportunity to get recruited. The hardest part is that most parents simply don’t know which are the necessary costs and which are not. Deciding on which showcases or camps to attend, what team to play for, and how to balance development, exposure, and rest this summer can be overwhelming and costly,” says Ethan Guevin and the KPB Staff in the article Parents: How to Balance Exposure and Spending in the search for Baseball Scholarships. The article continues with 8 quick facts about scholarships:
Understanding Scholarships
- College baseball is not like football or basketball where every scholarship is an all-encompassing ‘full-ride’. Baseball typically operates on partial scholarships that cover a fraction of the cost of attendance (total estimated cost of attending school for 1 school year).
- Baseball scholarship money may be coupled with academic money and financial aid to create a larger overall package for players, but the NCAA monitors and limits the amount of baseball scholarships allowed and also has its own standards for non-countable (towards baseball scholarship) academic aid to create a more level playing field. For example, it would be difficult for someone with low GPA and test scores to have academic money that doesn’t count against the NCAA limit. This creates a more even playing field despite different institutions having different academic requirements.
- Scholarships are calculated as a proportion of the costs of attendance at each school: (Baseball Scholarship Money Granted)/(Total Cost of Attendance)= NCAA equivalency % or % value of a scholarship. For example: If the total cost of attendance is $20,000 and you receive $10,000 in a baseball scholarship, you are on a 50% scholarship and count for .5 towards the NCAA maximum number of scholarships.
- Division 1 schools have an NCAA maximum of 11.7 full scholarships to divide up among a max of 27 scholarship players and a max of 35 guaranteed team roster spots. At present, if a player is going to be on a baseball scholarship, they must be on at least .25 (25%) baseball money.
- Division II schools have an NCAA maximum of 9 scholarships to give out and no roster limits.
- Division III schools do not give out athletic scholarships and instead financial packages are based around need-based aid and academic money.
- Beyond the scholarship limits enforced by the NCAA, each program prioritizes different positions. Pitching, for example, is often prioritized and can take up 40-65% of total scholarship money allotted to a school in a given year.
- A glance at the allotment of scholarships for one D1 team revealed that most baseball scholarships covered in the range of 25-55% of the cost of attendance, with only a few outside of that range. While every school is different, this is a fairly typical percent range covered by baseball scholarships.
“Based on the facts described above, coaches tend to focus their efforts recruiting in-state student-athletes, you can see that the best way to pay for your player to go to college is to combine a normal baseball scholarship that covers a percentage of the total cost of attendance, with academic aid that can often be even more substantial than the baseball scholarship offer. In other words, the best return on the money you spend on your son often centers around academics and making sure he has strong test scores and grades. This will not only keep his options open for more schools, it will also increase his chances of getting much more substantial aid from non-baseball sources.”
Click image to enlarge.
Players By Division
What level of competition are previous student-athletes from your state participating?
As blogged in Ethan Guevin and the KPB Staff’s article College Levels and Divisions: What’s the difference?, “Understanding the differences, with what each division offers and what is required in order to qualify academically is very important. Although student-athletes develop at different speeds, it can be helpful to understand the historical trends from your state. This does not preclude a student-athlete from attending any school, but provide a glimpse of which division student-athletes have participated.”
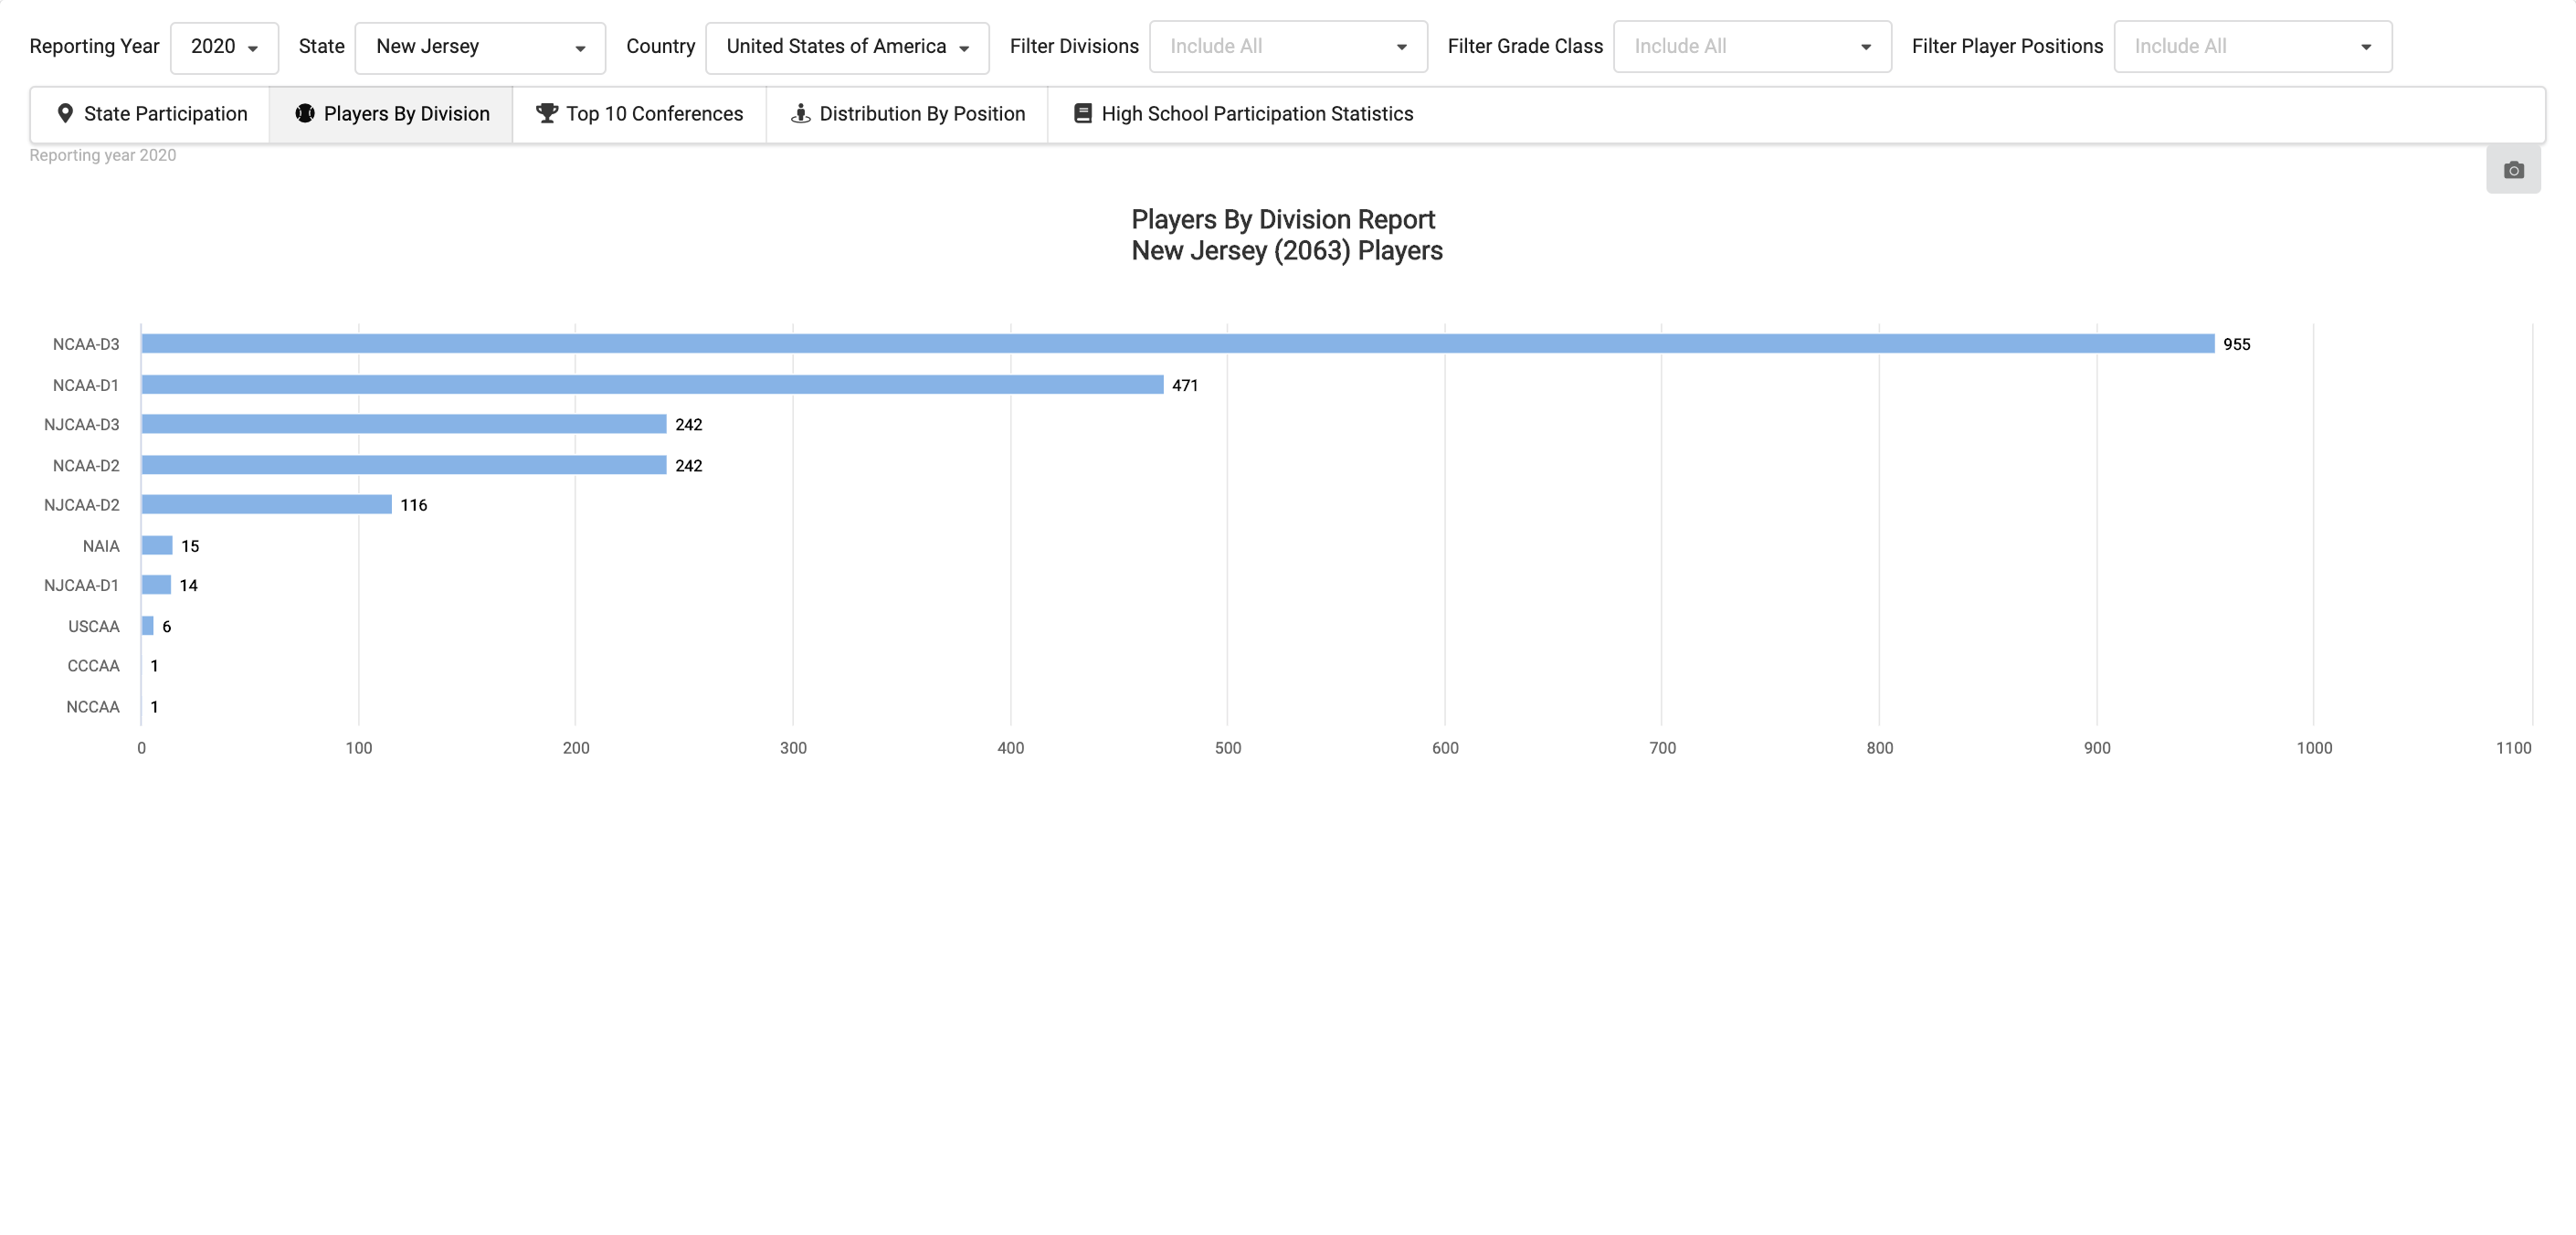
Click image to enlarge.
Top 10 Conferences
What are the top conferences which student-athletes from your home town state play?
“Educating yourself on the various levels of college baseball is very important. To do this properly, you are going to have to do a good job of researching more than just D1, D2, D3, NAIA, and JUCO baseball. Each of these divisions or organizations have a mix of different levels of play. For example, teams in the Division I Power-5 Conferences have a much different standard of play than mid-majors or under-funded Division I programs. Similarly, there are programs in every level of college baseball (JUCO and D3 included) that could compete with some or all of D1 programs on a regular basis. Because each division is such a diverse blend of talent, it makes doing your homework on schools and conferences of interest even more important. It may be that you can and should target D1 schools, but maybe not the D1 schools you are used to seeing on ESPN or College GameDay. We talk at length about the importance of researching schools and coaches here, but the same research should be done on conferences as well. The bottom line is you never want to assume anything and you should always make informed decisions in the recruiting process,” says Ethan Guevin and the KPB Staff in the article Targeting the Right Schools in Recruitment.
This can help you narrow in on where you would like to play when you take into consideration the level you’d like to play at and how competitive you would like to be. Keep in mind, College Baseball Insights is here to give you the information that you need to make the best decision for you!
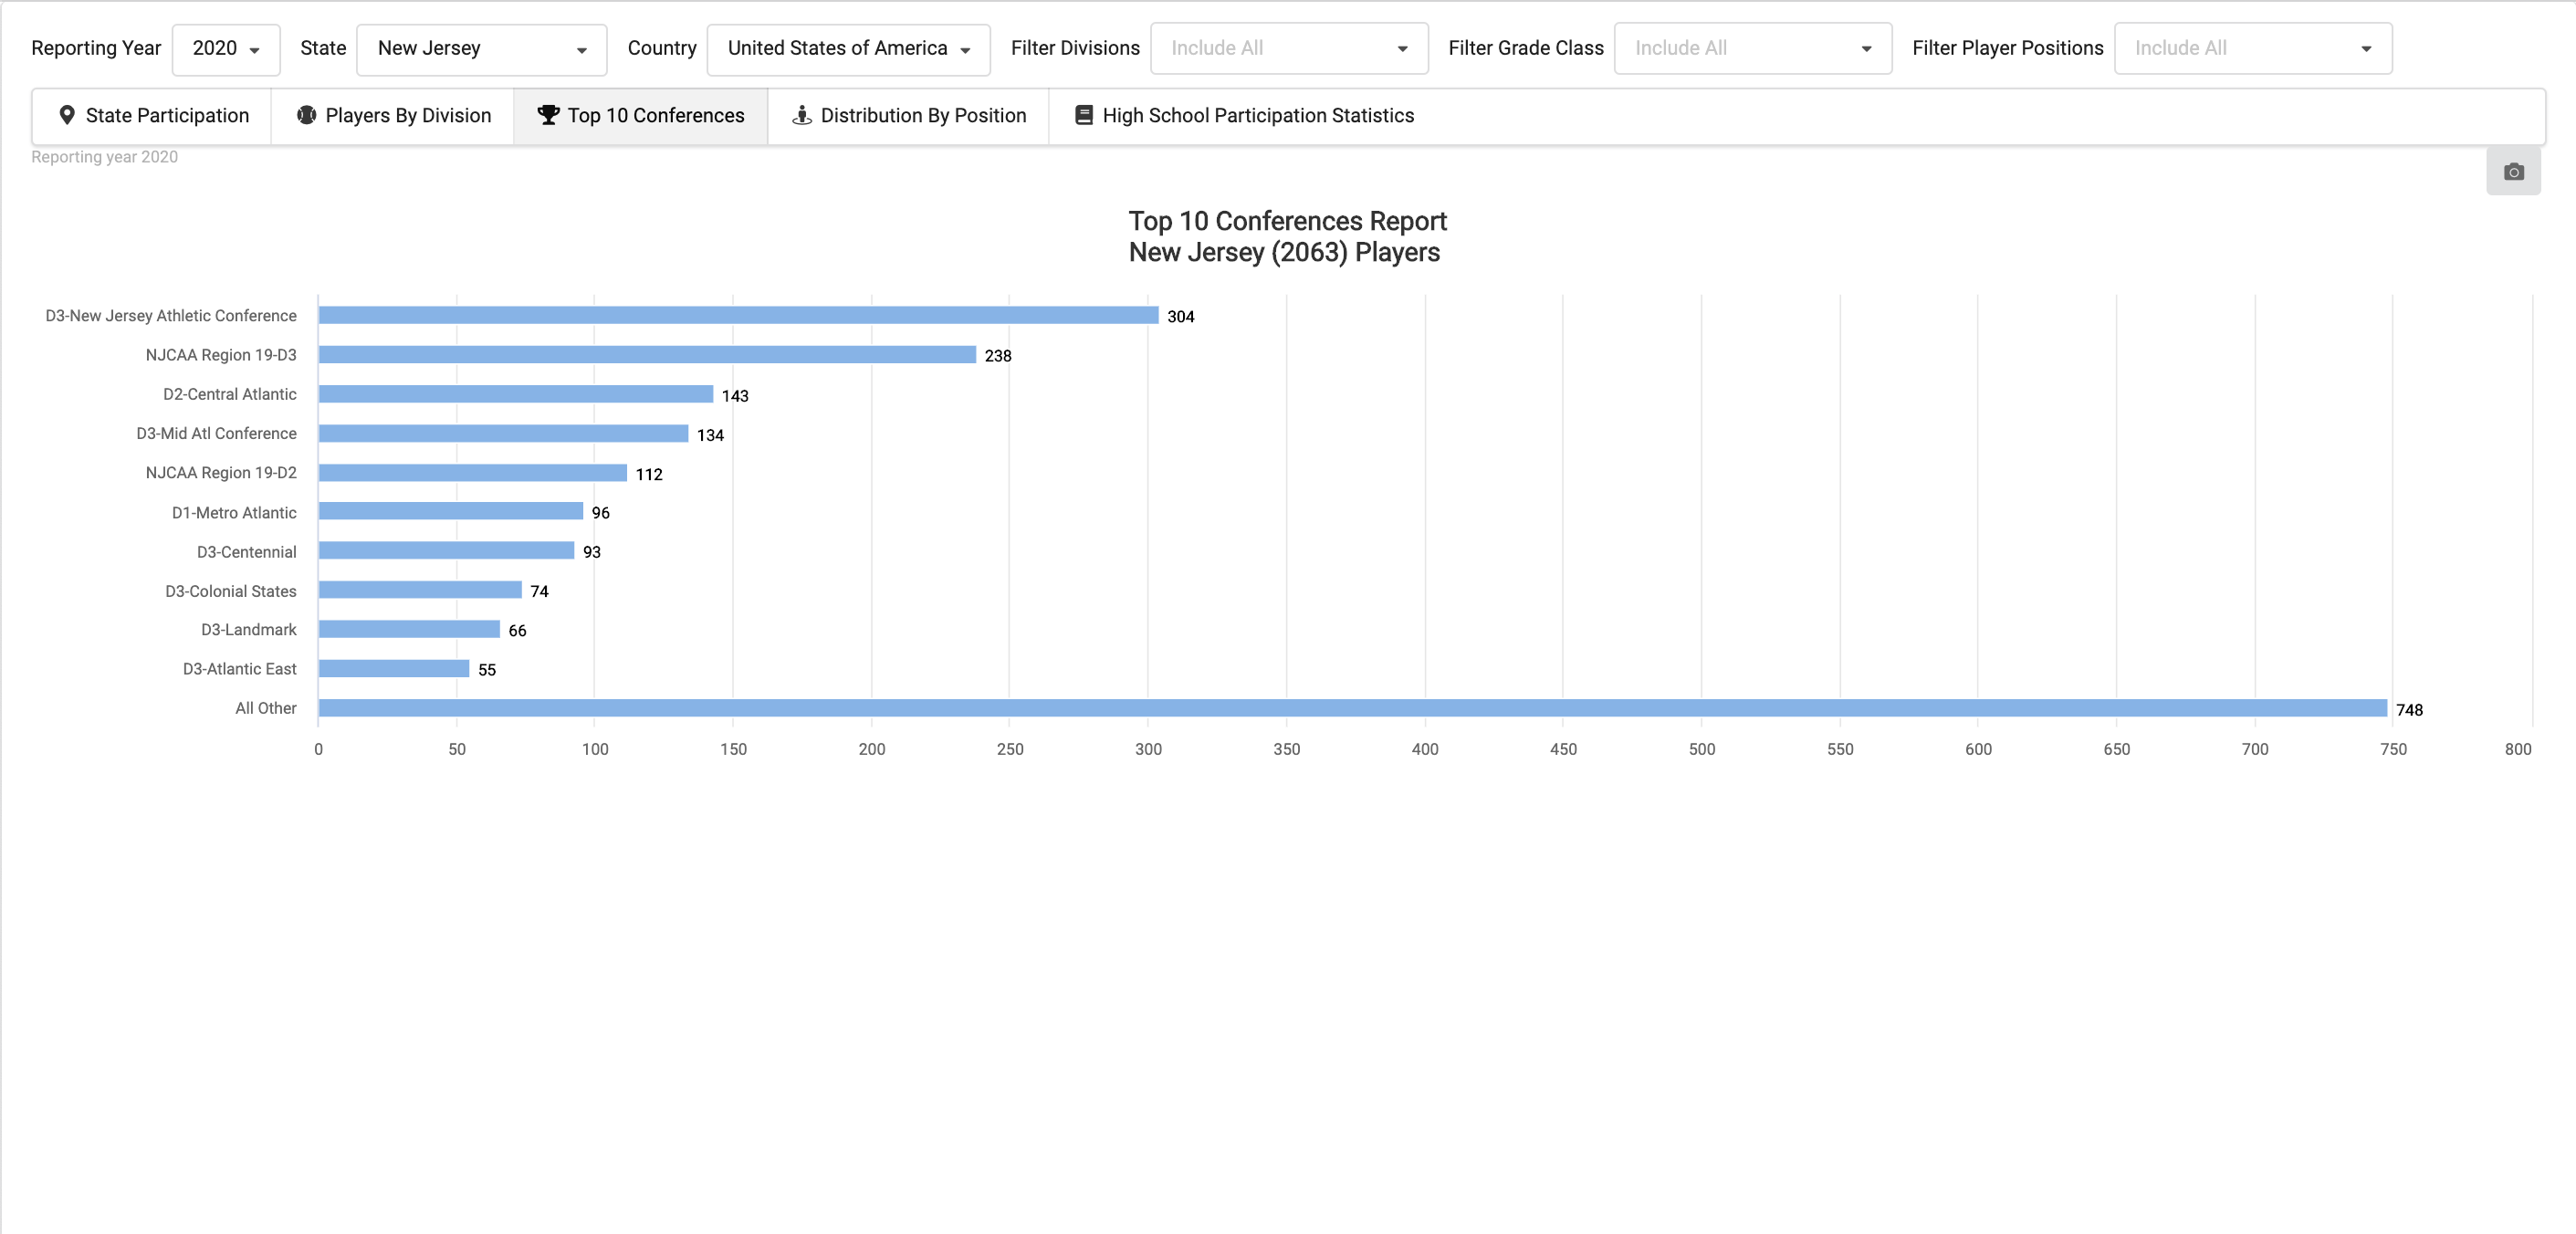
Click image to enlarge.
Distribution by Position
What is the primary position that players from your home state are playing in college?
Most coaches recruit student athletes based on need.
When you start your college baseball research, it is important to understand at a very high level, what are the historical trends from your state by position.
Note, this does not mean the student athlete can’t participate at the college level at their particular position of interest, this insight provide some context as to what trends have occurred over a period of time.
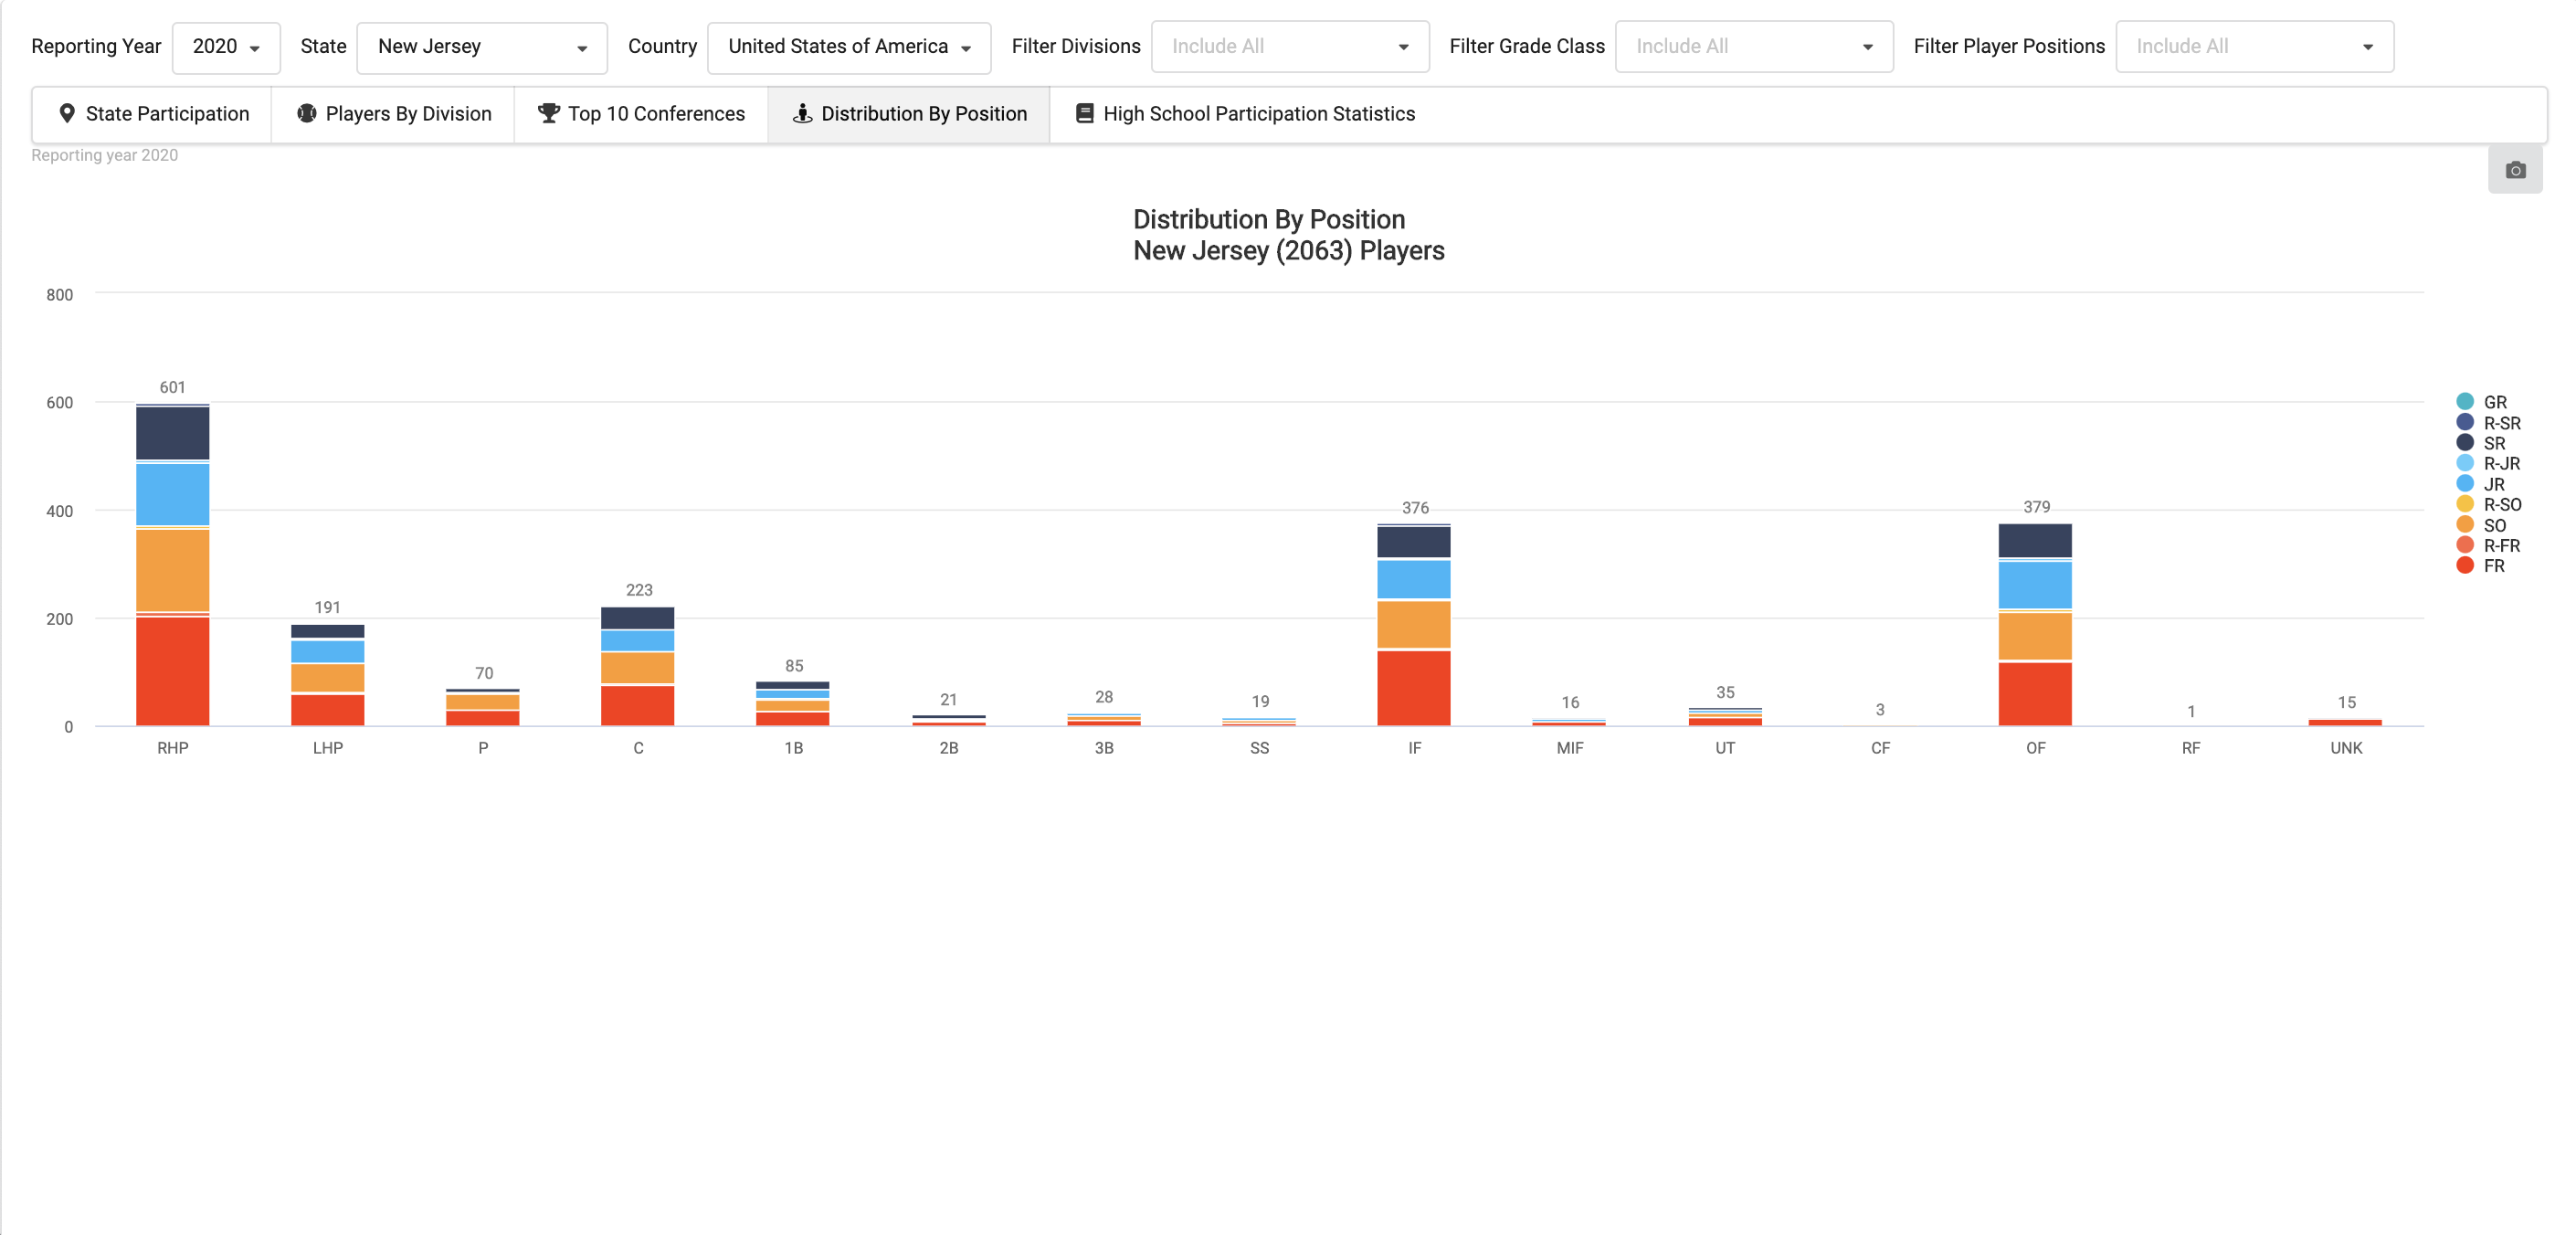
Click image to enlarge.
High School Participation Statistics
Have you ever wondered how many High School players from your state Participate annually?
Each year the National Federation of High School publishes state participation statistics. College Baseball Insights uses this information to provide some context as to the percentage of players would potentially play college baseball. You can find out the number of high schools, the number of high school players (based on the last 4 years of High School Participation Statistics), and a break down of what year they are currently in. This gives you a clear look at the statewide competition you as a player are against. It’s no secret that the recruiting process is very competitive. This report lets you know where you stand when it comes to other players in the state!
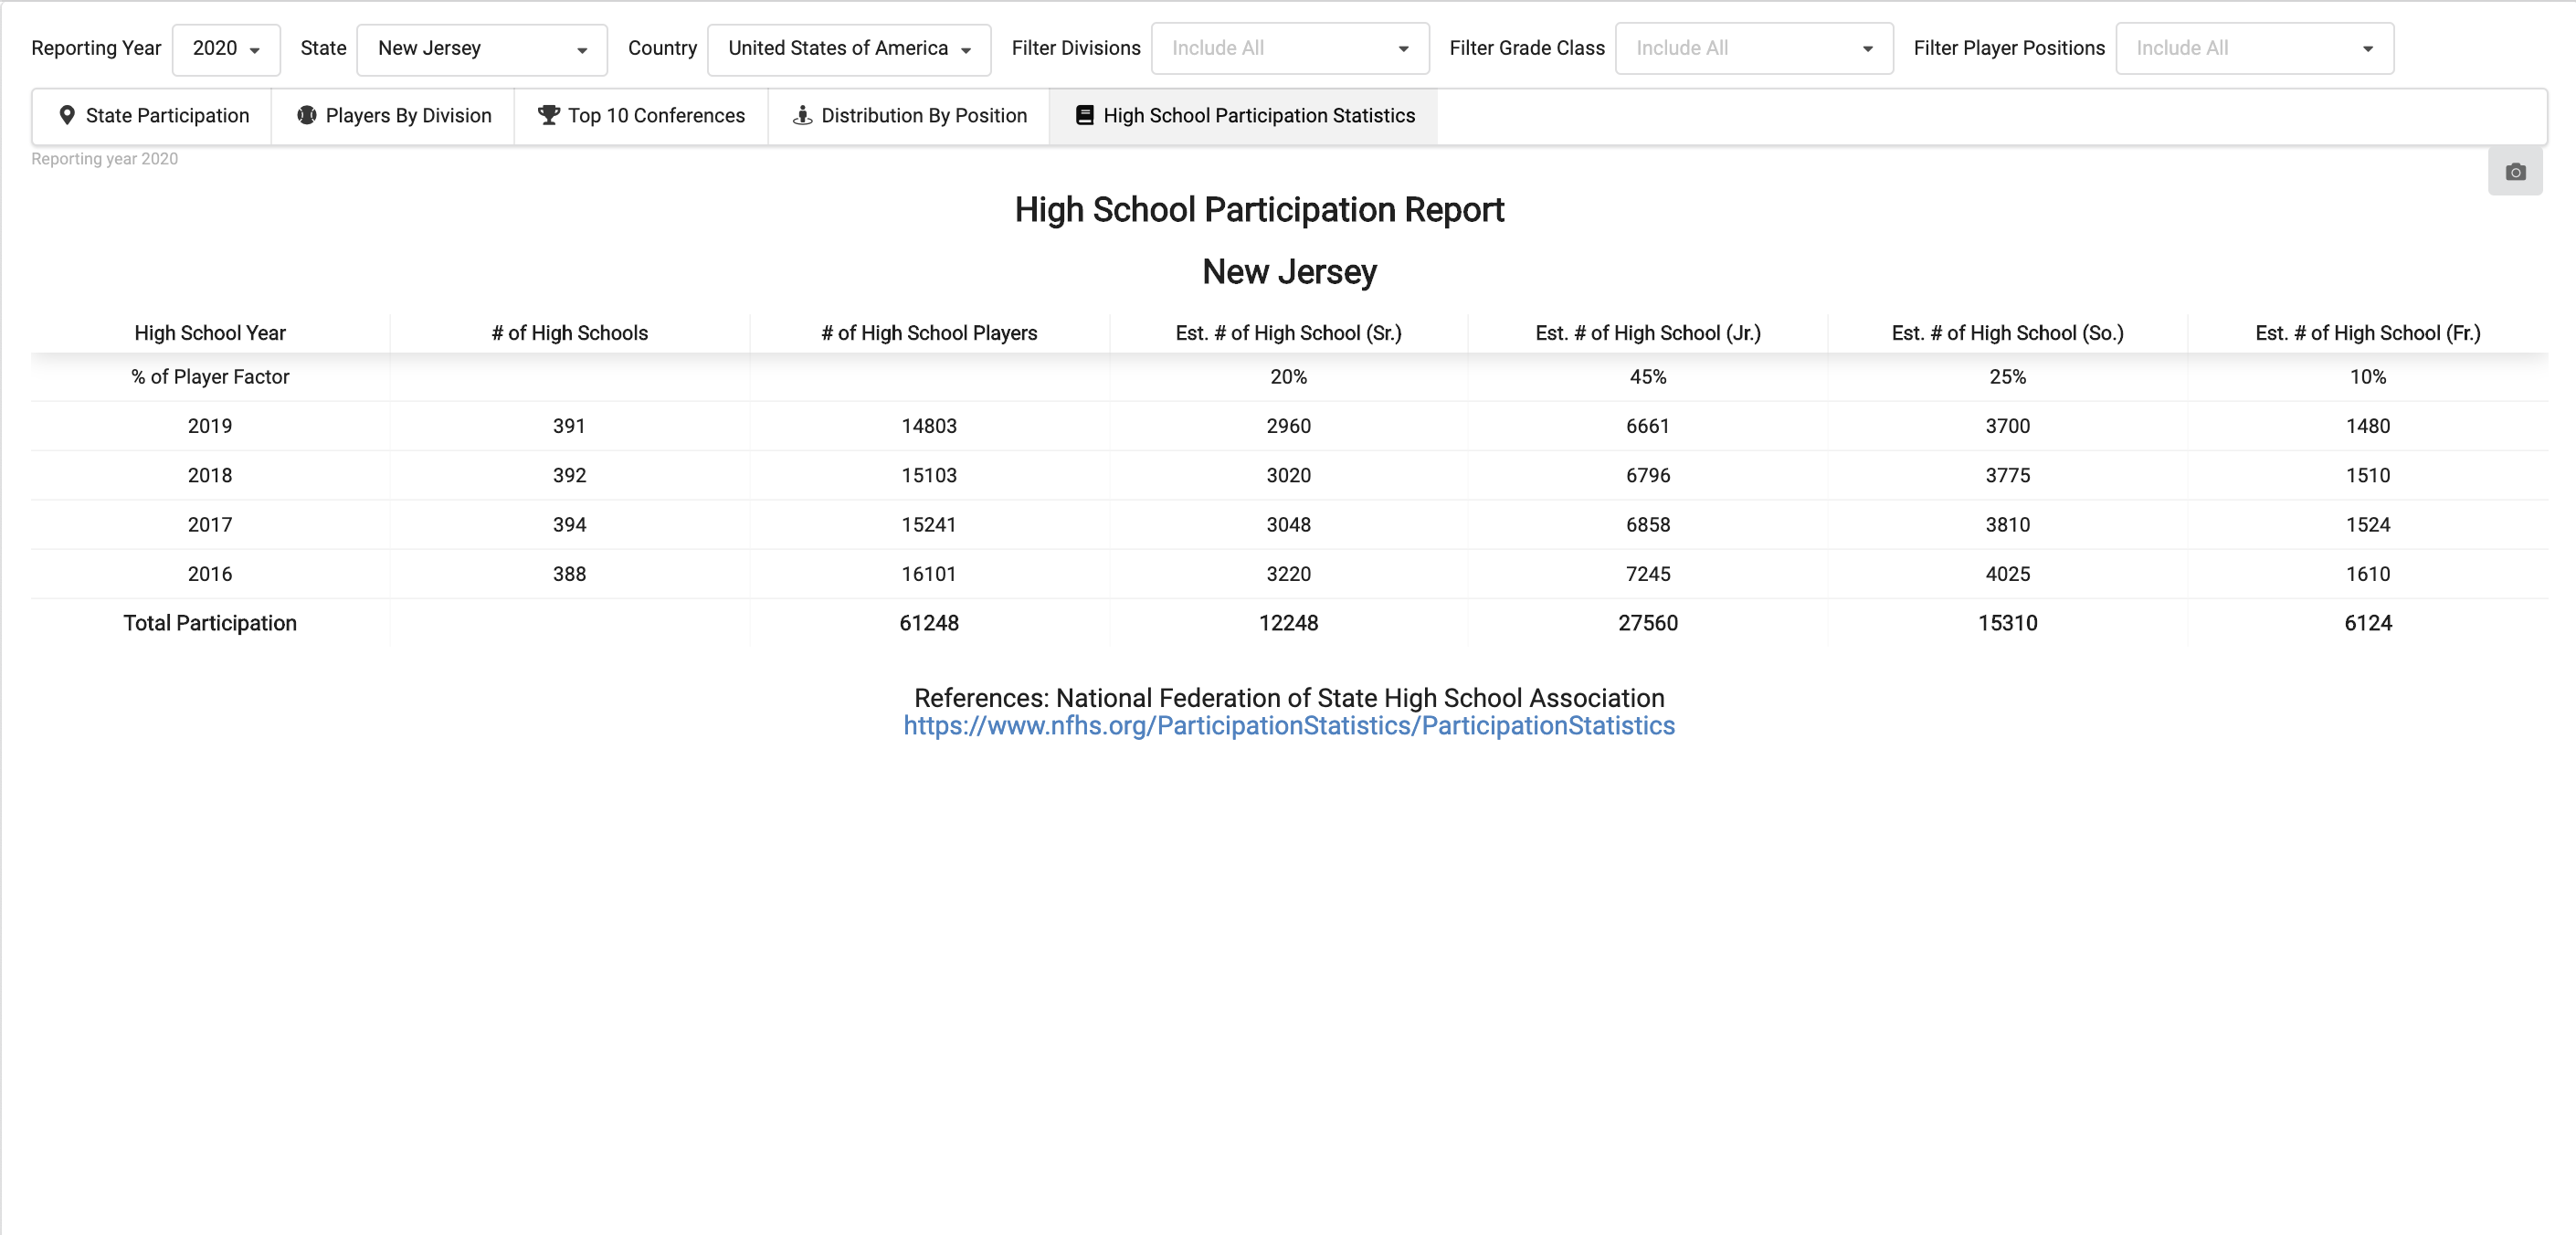
Click image to enlarge.
Conclusion
As a player, the information that you can gather from the State Participation Insights is extremely valuable. College Baseball Insights takes a hard stance on providing you the factual information that you need to help you make the best decision as a player. The State Participation Insights are one of those tools that can help you make that decision.